https://feeds.stacker.com/02da4660-8546-450e-b44b-06825d54933c/articles.xmlStacker2026-04-06T12:04:19-04:00urn:uuid:f1f0ff02-4ac2-4b73-9965-6e47822f4eaeHow gas prices have changed in Wenatchee in the last week2026-04-06T11:35:30-04:002026-04-06T11:35:30-04:00StackerWenatcheeStacker compiled statistics on gas prices in Wenatchee using data from AAA.]]>
pan demin // Shutterstock
How gas prices have changed in Wenatchee in the last week
Stacker compiled statistics on gas prices in Wenatchee, WA metro area using data from AAA. Gas prices are current as of April 6.
Wenatchee by the numbers - Gas current price: $5.18 --- Washington average: $5.39 - Week change: +$0.06 (+1.1%) - Year change: +$0.91 (+21.3%) - Historical expensive gas price: $5.44 (6/17/22)
Metros with the least expensive gas #1. Tulsa, OK: $3.22 #2. Lawton, OK: $3.23 #3. Oklahoma City, OK: $3.24
Read on to see which metros have the most expensive gas prices.
Christian Mueller // Shutterstock
#5. San Luis Obispo-Atascadero-Paso Robles, CA
- Regular gas price: $6.05
Istvan Csak // Shutterstock
#4. Napa, CA
- Regular gas price: $6.07
jittawit21 // Shutterstock
#3. San Francisco, CA
- Regular gas price: $6.08
Rangsarit Chaiyakun // Shutterstock
#2. Santa Rosa, CA
- Regular gas price: $6.11
Elen Nika // Shutterstock
#1. San Rafael, CA
- Regular gas price: $6.12]]>urn:uuid:e5c7949c-a1d8-4acb-b7c0-fc5466146fa4How gas prices have changed in Longview in the last week2026-04-06T11:34:03-04:002026-04-06T11:34:03-04:00StackerLongviewStacker compiled statistics on gas prices in Longview using data from AAA.]]>
pan demin // Shutterstock
How gas prices have changed in Longview in the last week
Stacker compiled statistics on gas prices in Longview, WA metro area using data from AAA. Gas prices are current as of April 6.
Longview by the numbers - Gas current price: $5.42 --- Washington average: $5.39 - Week change: +$0.11 (+2.0%) - Year change: +$1.02 (+23.1%) - Historical expensive gas price: $5.67 (10/10/22)
Metros with the least expensive gas #1. Tulsa, OK: $3.22 #2. Lawton, OK: $3.23 #3. Oklahoma City, OK: $3.24
Read on to see which metros have the most expensive gas prices.
Christian Mueller // Shutterstock
#5. San Luis Obispo-Atascadero-Paso Robles, CA
- Regular gas price: $6.05
Istvan Csak // Shutterstock
#4. Napa, CA
- Regular gas price: $6.07
jittawit21 // Shutterstock
#3. San Francisco, CA
- Regular gas price: $6.08
Rangsarit Chaiyakun // Shutterstock
#2. Santa Rosa, CA
- Regular gas price: $6.11
Daniel Avram // Shutterstock
#1. San Rafael, CA
- Regular gas price: $6.12]]>urn:uuid:748edc79-5d95-40a8-9168-1c552cdf28d4How gas prices have changed in Seattle in the last week2026-04-06T11:33:58-04:002026-04-06T11:33:58-04:00StackerSeattleStacker compiled statistics on gas prices in Seattle using data from AAA.]]>
pan demin // Shutterstock
How gas prices have changed in Seattle in the last week
Stacker compiled statistics on gas prices in Seattle-Bellevue-Everett, WA metro area using data from AAA. Gas prices are current as of April 6.
Seattle by the numbers - Gas current price: $5.62 --- Washington average: $5.39 - Week change: +$0.07 (+1.2%) - Year change: +$1.06 (+23.4%) - Historical expensive gas price: $5.69 (6/17/22)
Metros with the least expensive gas #1. Tulsa, OK: $3.22 #2. Lawton, OK: $3.23 #3. Oklahoma City, OK: $3.24
Read on to see which metros have the most expensive gas prices.
Istvan Csak // Shutterstock
#5. San Luis Obispo-Atascadero-Paso Robles, CA
- Regular gas price: $6.05
Elen Nika // Shutterstock
#4. Napa, CA
- Regular gas price: $6.07
Rangsarit Chaiyakun // Shutterstock
#3. San Francisco, CA
- Regular gas price: $6.08
Daniel Avram // Shutterstock
#2. Santa Rosa, CA
- Regular gas price: $6.11
Christian Mueller // Shutterstock
#1. San Rafael, CA
- Regular gas price: $6.12]]>urn:uuid:e9f31acf-10fb-4144-99f3-fb2f92967b1bHow gas prices have changed in Spokane in the last week2026-04-06T11:33:56-04:002026-04-06T11:33:56-04:00StackerSpokaneStacker compiled statistics on gas prices in Spokane using data from AAA.]]>
pan demin // Shutterstock
How gas prices have changed in Spokane in the last week
Stacker compiled statistics on gas prices in Spokane, WA metro area using data from AAA. Gas prices are current as of April 6.
Spokane by the numbers - Gas current price: $4.89 --- Washington average: $5.39 - Week change: +$0.02 (+0.4%) - Year change: +$0.83 (+20.3%) - Historical expensive gas price: $5.30 (6/14/22)
Metros with the least expensive gas #1. Tulsa, OK: $3.22 #2. Lawton, OK: $3.23 #3. Oklahoma City, OK: $3.24
Read on to see which metros have the most expensive gas prices.
Rangsarit Chaiyakun // Shutterstock
#5. San Luis Obispo-Atascadero-Paso Robles, CA
- Regular gas price: $6.05
Daniel Avram // Shutterstock
#4. Napa, CA
- Regular gas price: $6.07
Istvan Csak // Shutterstock
#3. San Francisco, CA
- Regular gas price: $6.08
Christian Mueller // Shutterstock
#2. Santa Rosa, CA
- Regular gas price: $6.11
Elen Nika // Shutterstock
#1. San Rafael, CA
- Regular gas price: $6.12]]>urn:uuid:efcddc39-334b-479f-9f92-308e3d57bf96How gas prices have changed in Bellingham in the last week2026-04-06T11:33:13-04:002026-04-06T11:33:13-04:00StackerBellinghamStacker compiled statistics on gas prices in Bellingham using data from AAA.]]>
pan demin // Shutterstock
How gas prices have changed in Bellingham in the last week
Stacker compiled statistics on gas prices in Bellingham, WA metro area using data from AAA. Gas prices are current as of April 6.
Bellingham by the numbers - Gas current price: $5.34 --- Washington average: $5.39 - Week change: +$0.06 (+1.1%) - Year change: +$0.97 (+22.2%) - Historical expensive gas price: $5.54 (10/10/22)
Metros with the least expensive gas #1. Tulsa, OK: $3.22 #2. Lawton, OK: $3.23 #3. Oklahoma City, OK: $3.24
Read on to see which metros have the most expensive gas prices.
Rangsarit Chaiyakun // Shutterstock
#5. San Luis Obispo-Atascadero-Paso Robles, CA
- Regular gas price: $6.05
jittawit21 // Shutterstock
#4. Napa, CA
- Regular gas price: $6.07
Daniel Avram // Shutterstock
#3. San Francisco, CA
- Regular gas price: $6.08
Istvan Csak // Shutterstock
#2. Santa Rosa, CA
- Regular gas price: $6.11
Elen Nika // Shutterstock
#1. San Rafael, CA
- Regular gas price: $6.12]]>urn:uuid:de0d3f33-6fc8-44fc-a719-d7a94c361478How gas prices have changed in Mount Vernon in the last week2026-04-06T11:33:11-04:002026-04-06T11:33:11-04:00StackerMount VernonStacker compiled statistics on gas prices in Mount Vernon using data from AAA.]]>
pan demin // Shutterstock
How gas prices have changed in Mount Vernon in the last week
Stacker compiled statistics on gas prices in Mount Vernon-Anacortes, WA metro area using data from AAA. Gas prices are current as of April 6.
Mount Vernon by the numbers - Gas current price: $5.27 --- Washington average: $5.39 - Week change: +$0.08 (+1.5%) - Year change: +$0.96 (+22.2%) - Historical expensive gas price: $5.50 (6/17/22)
Metros with the least expensive gas #1. Tulsa, OK: $3.22 #2. Lawton, OK: $3.23 #3. Oklahoma City, OK: $3.24
Read on to see which metros have the most expensive gas prices.
Daniel Avram // Shutterstock
#5. San Luis Obispo-Atascadero-Paso Robles, CA
- Regular gas price: $6.05
jittawit21 // Shutterstock
#4. Napa, CA
- Regular gas price: $6.07
Christian Mueller // Shutterstock
#3. San Francisco, CA
- Regular gas price: $6.08
Istvan Csak // Shutterstock
#2. Santa Rosa, CA
- Regular gas price: $6.11
Rangsarit Chaiyakun // Shutterstock
#1. San Rafael, CA
- Regular gas price: $6.12]]>urn:uuid:09edd1bf-6f02-4c72-b8f5-d1a4e2acca5dHow gas prices have changed in Olympia in the last week2026-04-06T11:33:09-04:002026-04-06T11:33:09-04:00StackerOlympiaStacker compiled statistics on gas prices in Olympia using data from AAA.]]>
pan demin // Shutterstock
How gas prices have changed in Olympia in the last week
Stacker compiled statistics on gas prices in Olympia, WA metro area using data from AAA. Gas prices are current as of April 6.
Olympia by the numbers - Gas current price: $5.42 --- Washington average: $5.39 - Week change: +$0.03 (+0.6%) - Year change: +$1.02 (+23.2%) - Historical expensive gas price: $5.57 (6/13/22)
Metros with the least expensive gas #1. Tulsa, OK: $3.22 #2. Lawton, OK: $3.23 #3. Oklahoma City, OK: $3.24
Read on to see which metros have the most expensive gas prices.
jittawit21 // Shutterstock
#5. San Luis Obispo-Atascadero-Paso Robles, CA
- Regular gas price: $6.05
Rangsarit Chaiyakun // Shutterstock
#4. Napa, CA
- Regular gas price: $6.07
Daniel Avram // Shutterstock
#3. San Francisco, CA
- Regular gas price: $6.08
Christian Mueller // Shutterstock
#2. Santa Rosa, CA
- Regular gas price: $6.11
Istvan Csak // Shutterstock
#1. San Rafael, CA
- Regular gas price: $6.12]]>urn:uuid:e7b68b31-ac88-485d-992a-da5f07b57db6How gas prices have changed in Walla Walla in the last week2026-04-06T11:32:26-04:002026-04-06T11:32:26-04:00StackerWalla WallaStacker compiled statistics on gas prices in Walla Walla using data from AAA.]]>
pan demin // Shutterstock
How gas prices have changed in Walla Walla in the last week
Stacker compiled statistics on gas prices in Walla Walla, WA metro area using data from AAA. Gas prices are current as of April 6.
Walla Walla by the numbers - Gas current price: $5.17 --- Washington average: $5.39 - Week change: +$0.02 (+0.3%) - Year change: +$0.86 (+19.9%) - Historical expensive gas price: $5.51 (6/18/22)
Metros with the least expensive gas #1. Tulsa, OK: $3.22 #2. Lawton, OK: $3.23 #3. Oklahoma City, OK: $3.24
Read on to see which metros have the most expensive gas prices.
jittawit21 // Shutterstock
#5. San Luis Obispo-Atascadero-Paso Robles, CA
- Regular gas price: $6.05
Rangsarit Chaiyakun // Shutterstock
#4. Napa, CA
- Regular gas price: $6.07
Elen Nika // Shutterstock
#3. San Francisco, CA
- Regular gas price: $6.08
Daniel Avram // Shutterstock
#2. Santa Rosa, CA
- Regular gas price: $6.11
Christian Mueller // Shutterstock
#1. San Rafael, CA
- Regular gas price: $6.12]]>urn:uuid:4b24d848-f92f-4e9d-b7e5-521c43228b2bHow gas prices have changed in Kennewick in the last week2026-04-06T11:32:22-04:002026-04-06T11:32:22-04:00StackerKennewickStacker compiled statistics on gas prices in Kennewick using data from AAA.]]>
pan demin // Shutterstock
How gas prices have changed in Kennewick in the last week
Stacker compiled statistics on gas prices in Richland-Kennewick-Pasco, WA metro area using data from AAA. Gas prices are current as of April 6.
Kennewick by the numbers - Gas current price: $5.07 --- Washington average: $5.39 - Week change: +$0.01 (+0.2%) - Year change: +$0.91 (+22.0%) - Historical expensive gas price: $5.31 (6/15/22)
Metros with the least expensive gas #1. Tulsa, OK: $3.22 #2. Lawton, OK: $3.23 #3. Oklahoma City, OK: $3.24
Read on to see which metros have the most expensive gas prices.
Daniel Avram // Shutterstock
#5. San Luis Obispo-Atascadero-Paso Robles, CA
- Regular gas price: $6.05
Rangsarit Chaiyakun // Shutterstock
#4. Napa, CA
- Regular gas price: $6.07
Elen Nika // Shutterstock
#3. San Francisco, CA
- Regular gas price: $6.08
Christian Mueller // Shutterstock
#2. Santa Rosa, CA
- Regular gas price: $6.11
jittawit21 // Shutterstock
#1. San Rafael, CA
- Regular gas price: $6.12]]>urn:uuid:9ae471bc-236d-482d-9cb8-9481f1a70925How gas prices have changed in Bremerton in the last week2026-04-06T11:32:15-04:002026-04-06T11:32:15-04:00StackerBremertonStacker compiled statistics on gas prices in Bremerton using data from AAA.]]>
pan demin // Shutterstock
How gas prices have changed in Bremerton in the last week
Stacker compiled statistics on gas prices in Bremerton, WA metro area using data from AAA. Gas prices are current as of April 6.
Bremerton by the numbers - Gas current price: $5.47 --- Washington average: $5.39 - Week change: +$0.09 (+1.7%) - Year change: +$1.00 (+22.2%) - Historical expensive gas price: $5.52 (6/14/22)
Metros with the least expensive gas #1. Tulsa, OK: $3.22 #2. Lawton, OK: $3.23 #3. Oklahoma City, OK: $3.24
Read on to see which metros have the most expensive gas prices.
Elen Nika // Shutterstock
#5. San Luis Obispo-Atascadero-Paso Robles, CA
- Regular gas price: $6.05
Christian Mueller // Shutterstock
#4. Napa, CA
- Regular gas price: $6.07
Rangsarit Chaiyakun // Shutterstock
#3. San Francisco, CA
- Regular gas price: $6.08
Daniel Avram // Shutterstock
#2. Santa Rosa, CA
- Regular gas price: $6.11
Istvan Csak // Shutterstock
#1. San Rafael, CA
- Regular gas price: $6.12]]>urn:uuid:3c2654ab-4aad-4263-8509-a3360dca52d0How gas prices have changed in Yakima in the last week2026-04-06T11:32:11-04:002026-04-06T11:32:11-04:00StackerYakimaStacker compiled statistics on gas prices in Yakima using data from AAA.]]>
pan demin // Shutterstock
How gas prices have changed in Yakima in the last week
Stacker compiled statistics on gas prices in Yakima, WA metro area using data from AAA. Gas prices are current as of April 6.
Yakima by the numbers - Gas current price: $5.01 --- Washington average: $5.39 - Week change: +$0.02 (+0.5%) - Year change: +$0.87 (+20.9%) - Historical expensive gas price: $5.40 (6/15/22)
Metros with the least expensive gas #1. Tulsa, OK: $3.22 #2. Lawton, OK: $3.23 #3. Oklahoma City, OK: $3.24
Read on to see which metros have the most expensive gas prices.
Daniel Avram // Shutterstock
#5. San Luis Obispo-Atascadero-Paso Robles, CA
- Regular gas price: $6.05
Rangsarit Chaiyakun // Shutterstock
#4. Napa, CA
- Regular gas price: $6.07
Istvan Csak // Shutterstock
#3. San Francisco, CA
- Regular gas price: $6.08
jittawit21 // Shutterstock
#2. Santa Rosa, CA
- Regular gas price: $6.11
Christian Mueller // Shutterstock
#1. San Rafael, CA
- Regular gas price: $6.12]]>urn:uuid:862c3733-79f0-429a-9e73-81811ae3d9beHow gas prices have changed in Washington in the last week2026-04-03T12:59:40-04:002026-04-03T12:59:40-04:00StackerWashingtonStacker compiled statistics on gas prices in Washington using data from AAA.]]>
jittawit21 // Shutterstock
How gas prices have changed in Washington in the last week
Stacker compiled statistics on gas prices in Washington using data from AAA. Gas prices are as of April 3.
Washington by the numbers - Gas current price: $5.37 - Week change: +$0.06 (+1.2%) - Year change: +$1.07 (+24.9%) - Historical expensive gas price: $5.55 (6/16/22)
Metros with most expensive gas in Washington #1. Seattle-Bellevue-Everett: $5.60 #2. Tacoma: $5.47 #3. Bremerton: $5.44 #4. Olympia: $5.43 #5. Longview: $5.43 #6. Vancouver: $5.36 #7. Bellingham: $5.30 #8. Mount Vernon-Anacortes: $5.25 #9. Wenatchee: $5.17 #10. Walla Walla: $5.15 #11. Richland-Kennewick-Pasco: $5.08 #12. Yakima: $5.02 #13. Spokane: $4.90 #14. Clarkson: $4.75
States with the least expensive gas #1. Oklahoma: $3.27 #2. Kansas: $3.34 #3. North Dakota: $3.44 #4. Nebraska: $3.46 #5. Iowa: $3.50
Read on to see which states have the most expensive gas prices.
Elen Nika // Shutterstock
#5. Nevada
- Regular gas price: $4.96
Rangsarit Chaiyakun // Shutterstock
#4. Oregon
- Regular gas price: $4.97
Istvan Csak // Shutterstock
#3. Washington
- Regular gas price: $5.37
Christian Mueller // Shutterstock
#2. Hawaii
- Regular gas price: $5.55
Daniel Avram // Shutterstock
#1. California
- Regular gas price: $5.89]]>urn:uuid:0d984817-0ea3-4e51-960e-df4ccb39c5efHottest Aprils in Washington since 18952026-04-02T19:29:11-04:002026-04-02T19:29:11-04:00StackerWashingtonStacker compiled a ranking of the hottest Aprils in Washington since 1895 using data from the National Centers for Environmental Information]]>
Happy Together // Shutterstock
Climate change is driving rising temperatures and more record heat. The Earth’s temperature has climbed each decade since 1880 by about .14 degrees Fahrenheit, or roughly 2 degrees Fahrenheit total.
Stacker compiled a ranking of the hottest Aprils in Washington since 1895 using data from the National Centers for Environmental Information. Rankings are based on the highest average temperature in each month. For each of the hottest months listed below, we've included the average state temperature, state-wide highs and lows for the month, and the total precipitation.
#8. April 2004 (tie) - Average temperature: 48.6°F - Monthly high temperature: 61.2°F - Monthly low temperature: 35.9°F - Total precipitation: 1.35"
#8. April 1990 (tie) - Average temperature: 48.6°F - Monthly high temperature: 59.3°F - Monthly low temperature: 37.9°F - Total precipitation: 2.89"
#8. April 1941 (tie) - Average temperature: 48.6°F - Monthly high temperature: 60.6°F - Monthly low temperature: 36.6°F - Total precipitation: 2.33"
#7. April 1930 - Average temperature: 48.7°F - Monthly high temperature: 60.7°F - Monthly low temperature: 36.7°F - Total precipitation: 2.4"
#6. April 1906 - Average temperature: 48.8°F - Monthly high temperature: 61.8°F - Monthly low temperature: 35.9°F - Total precipitation: 0.98"
#5. April 1987 - Average temperature: 48.9°F - Monthly high temperature: 60.5°F - Monthly low temperature: 37.3°F - Total precipitation: 2.46"
#4. April 1915 - Average temperature: 49.1°F - Monthly high temperature: 61.5°F - Monthly low temperature: 36.6°F - Total precipitation: 3.06"
#3. April 1926 - Average temperature: 50.6°F - Monthly high temperature: 64°F - Monthly low temperature: 37.2°F - Total precipitation: 1.41"
#2. April 2016 - Average temperature: 51.6°F - Monthly high temperature: 63.3°F - Monthly low temperature: 39.8°F - Total precipitation: 1.6"
#1. April 1934 - Average temperature: 52.1°F - Monthly high temperature: 65°F - Monthly low temperature: 39.2°F - Total precipitation: 1.61"
]]>urn:uuid:5f3ba028-be12-40ea-8d21-e8742a05fb21Top 25 songs in Seattle on Shazam in the past week2026-04-02T18:50:19-04:002026-04-02T18:50:19-04:00StackerSeattleStacker compiled a list of the most Shazamed songs in Seattle.]]>
Bohdan Aleksandrovych // Shutterstock
Top 25 songs in Seattle on Shazam in the past week
Stacker compiled a list of the most Shazamed songs in Seattle. Data is as of April 02, 2026. Keep reading to see which of your favorite songs made the list.
#25. back to friends - Artist: sombr - Popularity in other metros --- Top five song in four other metros --- Top 10 song in nine other metros --- Top 20 song in 28 other metros --- Top 25 song in 35 other metros
#24. Die On This Hill - Artist: SIENNA SPIRO - Popularity in other metros --- Top five song in three other metros --- Top 10 song in 16 other metros --- Top 20 song in 32 other metros --- Top 25 song in 40 other metros
#23. Opalite - Artist: Taylor Swift - Popularity in other metros --- Top 10 song in one other metro --- Top 20 song in five other metros --- Top 25 song in eight other metros --- Top 50 song in 24 other metros
#22. Deadly Valentine - Artist: Charlotte Gainsbourg - Popularity in other metros --- Top 20 song in one other metro --- Top 25 song in three other metros --- Top 50 song in nine other metros
#21. Here With Me - Artist: Dido - Popularity in other metros --- Top song in one other metro --- Top three song in two other metros --- Top five song in three other metros --- Top 10 song in nine other metros
#20. Be Like a Woman - Artist: Chris Rainbow - Popularity in other metros --- Top three song in one other metro --- Top 10 song in four other metros --- Top 20 song in 12 other metros --- Top 25 song in 13 other metros
#19. Iris - Artist: The Goo Goo Dolls - Popularity in other metros --- Top 10 song in three other metros --- Top 20 song in 11 other metros --- Top 25 song in 22 other metros --- Top 50 song in 54 other metros
#18. We Will Not Be Lovers (2013 Remaster) - Artist: The Waterboys - Popularity in other metros --- Top 20 song in one other metro --- Top 25 song in two other metros --- Top 50 song in 16 other metros
#17. Freakin' Out - Artist: Dexter and The Moonrocks - Popularity in other metros --- Top song in one other metro --- Top three song in four other metros --- Top five song in nine other metros --- Top 10 song in 19 other metros
#16. Raindance - Artist: Dave & Tems - Popularity in other metros --- Top song in four other metros --- Top three song in six other metros --- Top five song in nine other metros --- Top 10 song in 18 other metros
#15. SWIM - Artist: BTS - Popularity in other metros --- Top 10 song in one other metro --- Top 20 song in three other metros --- Top 25 song in five other metros --- Top 50 song in 22 other metros
#14. CHANEL - Artist: Tyla - Popularity in other metros --- Top 10 song in two other metros --- Top 20 song in four other metros --- Top 50 song in 10 other metros
#13. Babydoll - Artist: Dominic Fike - Popularity in other metros --- Top 10 song in three other metros --- Top 20 song in 12 other metros --- Top 25 song in 22 other metros --- Top 50 song in 44 other metros
#12. I Just Might - Artist: Bruno Mars - Popularity in other metros --- Top three song in three other metros --- Top five song in five other metros --- Top 10 song in 24 other metros --- Top 20 song in 55 other metros
#11. Dracula (JENNIE Remix) - Artist: Tame Impala & JENNIE - Popularity in other metros --- Top five song in one other metro --- Top 10 song in four other metros --- Top 20 song in five other metros --- Top 25 song in seven other metros
#10. Jamaican (Bam Bam) - Artist: HUGEL & SOLTO (FR) - Popularity in other metros --- Top three song in one other metro --- Top five song in two other metros --- Top 10 song in three other metros --- Top 20 song in eight other metros
#9. Choosin' Texas - Artist: Ella Langley - Popularity in other metros --- Top song in 18 other metros --- Top three song in 27 other metros --- Top five song in 35 other metros --- Top 10 song in 43 other metros
#8. Dracula - Artist: Tame Impala - Popularity in other metros --- Top three song in one other metro --- Top five song in six other metros --- Top 10 song in 15 other metros --- Top 20 song in 29 other metros
#7. Folded - Artist: Kehlani - Popularity in other metros --- Top five song in one other metro --- Top 10 song in three other metros --- Top 20 song in 21 other metros --- Top 25 song in 30 other metros
#6. Man I Need - Artist: Olivia Dean - Popularity in other metros --- Top song in 13 other metros --- Top three song in 24 other metros --- Top five song in 29 other metros --- Top 10 song in 48 other metros
#5. I Remember Everything (feat. Kacey Musgraves) - Artist: Zach Bryan - Popularity in other metros --- Top 10 song in two other metros --- Top 20 song in four other metros --- Top 50 song in 16 other metros
#4. Right Now - Artist: Rosi Golan - Popularity in other metros --- Top three song in one other metro --- Top 10 song in three other metros --- Top 20 song in 14 other metros --- Top 25 song in 21 other metros
#3. Rescue - Artist: Lauren Daigle - Popularity in other metros --- Top song in two other metros --- Top three song in 10 other metros --- Top five song in 17 other metros --- Top 10 song in 32 other metros
#2. So Easy (To Fall In Love) - Artist: Olivia Dean - Popularity in other metros --- Top song in three other metros --- Top three song in 16 other metros --- Top five song in 26 other metros --- Top 10 song in 44 other metros
#1. Hurts - Artist: EBEN
]]>urn:uuid:b778827a-8967-4e99-a414-5705bb86af31Movies and TV shows casting in Olympia2026-04-01T05:06:00-04:002026-04-01T05:06:00-04:00BackstageOlympiaBackstage compiled a list of movies and TV shows casting in Olympia.]]>
Media_Photos // Shutterstock
Movies and TV shows casting in Olympia
The glitz and glam of Hollywood captures attention starting from an early age. Beyond celebrities' Instagram Stories and red carpet poses, there are actors out there paying their dues and honing their craft in pursuit of a sustainable career or a fulfilling sideline. Submitting to casting calls is a big part of that journey.
Whether you're a working actor or an aspiring one, you might be curious to know which movies and TV shows are casting roles near you. Backstage compiled a list of projects casting right now in Olympia, nearby cities, and nationwide, and which roles they're looking to fill.
Dpongvit // Shutterstock
'One-way Train'
- Project type: student film - Roles: --- Elderly Arthur (lead, male, 50+) --- Middle-Aged Arthur (supporting, male, 25-45) --- Young Arthur (supporting, male, 8-12) - Roles pay up to: $400 - Casting locations: Olympia - Learn more about the student film here
Grusho Anna // Shutterstock
'Villainy'
- Project type: student film - Roles: --- John Evillmann AKA 'Evil Man' (lead, male, 18-35) - Roles pay up to: $800 - Casting locations: Olympia - Learn more about the student film here
Grusho Anna // Shutterstock
'Bilateral'
- Project type: short film - Roles: --- Jacob (supporting, male, 20-30) --- Abigail's Dad's Friend (background / extra, male, 40-65) - Roles pay up to: $200 - Casting locations: Olympia - Learn more about the short film here
Grusho Anna // Shutterstock
'The Chambers'
- Project type: feature film - Roles: --- Elijah (lead, male, 24-40) - Roles pay up to: $5,000 - Casting: nationwide - Learn more about the feature film here
Grusho Anna // Shutterstock
'Autonomous'
- Project type: feature film - Roles: --- Alistair Mallen (lead, male, 26-40) --- Maggie Thomas (lead, female, 20-30) --- Magda Jansen (supporting, female, 40-55) - Roles pay up to: $1,500 - Casting: nationwide - Learn more about the feature film here
guruXOX // Shutterstock
'Taco Man'
- Project type: vertical series - Roles: --- Tony (lead, male, 35-45) --- Aurora ("Rori") (lead, female, 18-22) - Roles pay up to: $1,000 - Casting: nationwide - Learn more about the vertical series here
Gorodenkoff // Shutterstock
'Painted with L.O.V.E.'
- Project type: feature film - Roles: --- Lilly (lead, female, 22-30) --- Patrick Jones (lead, 25-35) --- Lois (supporting, female, 22-30) - Roles pay up to: $10,000 - Casting: nationwide - Learn more about the feature film here
Gorodenkoff // Shutterstock
'Adventskalendar'
- Project type: reality TV - Roles: --- German Wrestler (day player, 18+) - Roles pay up to: $800 - Casting: nationwide - Learn more about the reality TV show here
KinoMasterskaya // Shutterstock
'Sydney Campbell is Dead to Me'
- Project type: feature film - Roles: --- Sydney (lead, female, 21-36) --- Male Characters (lead, male, 21-80) - Roles pay up to: $12,000 - Casting: nationwide - Learn more about the feature film here
Tikkyshop // Shutterstock
Family Weight Loss Show
- Project type: reality TV - Roles: --- Family Member (real people, 18-65) - Roles pay up to: $11,000 - Casting: nationwide - Learn more about the reality TV show here
]]>urn:uuid:dd7574d8-d3f0-497a-a220-9db86706cf32Movies and TV shows casting in Seattle2026-04-01T05:06:00-04:002026-04-01T05:06:00-04:00BackstageSeattleBackstage compiled a list of movies and TV shows casting in Seattle.]]>
Gorodenkoff // Shutterstock
Movies and TV shows casting in Seattle
The glitz and glam of Hollywood captures attention starting from an early age. Beyond celebrities' Instagram Stories and red carpet poses, there are actors out there paying their dues and honing their craft in pursuit of a sustainable career or a fulfilling sideline. Submitting to casting calls is a big part of that journey.
Whether you're a working actor or an aspiring one, you might be curious to know which movies and TV shows are casting roles near you. Backstage compiled a list of projects casting right now in Seattle, nearby cities, and nationwide, and which roles they're looking to fill.
guruXOX // Shutterstock
'Open'
- Project type: feature film - Roles: --- Ally (Alejandra) (supporting, female, 18-24) - Roles pay up to: $964 - Casting locations: Seattle - Learn more about the feature film here
KinoMasterskaya // Shutterstock
'A Wanderer'
- Project type: feature film - Roles: --- Amber Di Marco (supporting, female, 25-40) --- Pete Di Marco (supporting, male, 30-40) --- Isabel (supporting, female, 18-25) - Roles pay up to: $1,250 - Casting locations: Seattle - Learn more about the feature film here
Media_Photos // Shutterstock
'One-way Train'
- Project type: student film - Roles: --- Elderly Arthur (lead, male, 50+) --- Middle-Aged Arthur (supporting, male, 25-45) --- Young Arthur (supporting, male, 8-12) - Roles pay up to: $400 - Casting locations: Seattle - Learn more about the student film here
Grusho Anna // Shutterstock
'Villainy'
- Project type: student film - Roles: --- John Evillmann AKA 'Evil Man' (lead, male, 18-35) - Roles pay up to: $800 - Casting locations: Seattle - Learn more about the student film here
Media_Photos // Shutterstock
'Mike Is The Worst' Episode 2.5
- Project type: scripted show - Roles: --- Blue Beattle (supporting, male, 18+) --- Black Panther (lead, male, 18+) --- Plumber 1 (lead, male, 18+) - Roles pay up to: $100 - Casting locations: Seattle - Learn more about the scripted show here
Grusho Anna // Shutterstock
'Matadors'
- Project type: short film - Roles: --- Kelly (lead, female, male, non-binary, 18-30) --- AL (lead, male, 40-60) --- Sam (supporting, female, male, non-binary, 18+) - Roles pay up to: $50 - Casting locations: Seattle - Learn more about the short film here
Grusho Anna // Shutterstock
Untitled Coming of Age Feature Horror Film
- Project type: feature film - Roles: --- Madison (lead, female, 18-33) --- Katy (lead, female, 18-33) - Casting locations: Seattle - Learn more about the feature film here
Grusho Anna // Shutterstock
'The Chambers'
- Project type: feature film - Roles: --- Elijah (lead, male, 24-40) - Roles pay up to: $5,000 - Casting: nationwide - Learn more about the feature film here
Tikkyshop // Shutterstock
'Autonomous'
- Project type: feature film - Roles: --- Alistair Mallen (lead, male, 26-40) --- Maggie Thomas (lead, female, 20-30) --- Magda Jansen (supporting, female, 40-55) - Roles pay up to: $1,500 - Casting: nationwide - Learn more about the feature film here
Gorodenkoff // Shutterstock
'Taco Man'
- Project type: vertical series - Roles: --- Tony (lead, male, 35-45) --- Aurora ("Rori") (lead, female, 18-22) - Roles pay up to: $1,000 - Casting: nationwide - Learn more about the vertical series here
Media_Photos // Shutterstock
'Painted with L.O.V.E.'
- Project type: feature film - Roles: --- Lilly (lead, female, 22-30) --- Patrick Jones (lead, 25-35) --- Lois (supporting, female, 22-30) - Roles pay up to: $10,000 - Casting: nationwide - Learn more about the feature film here
Dpongvit // Shutterstock
'Adventskalendar'
- Project type: reality TV - Roles: --- German Wrestler (day player, 18+) - Roles pay up to: $800 - Casting: nationwide - Learn more about the reality TV show here
Grusho Anna // Shutterstock
'Sydney Campbell is Dead to Me'
- Project type: feature film - Roles: --- Sydney (lead, female, 21-36) --- Male Characters (lead, male, 21-80) - Roles pay up to: $12,000 - Casting: nationwide - Learn more about the feature film here
Grusho Anna // Shutterstock
Family Weight Loss Show
- Project type: reality TV - Roles: --- Family Member (real people, 18-65) - Roles pay up to: $11,000 - Casting: nationwide - Learn more about the reality TV show here
]]>urn:uuid:ceb7e93a-12f4-4da1-9348-d322e8dd7f8a<![CDATA[Bunny baskets and Seder staples: Washington's Easter and Passover trends]]>2026-03-31T12:45:37-04:002026-03-31T12:45:37-04:00StackerWashingtonInstacart reports on Easter and Seder trends in Washington and across the country.]]>
aerogondo2 // Shutterstock
Bunny baskets and Seder staples: Washington's Easter and Passover trends
When Easter and Passover arrive, shopping carts transform — filling up with chocolate bunnies, fresh florals, and time-honored holiday staples.
This past year, Easter and Passover overlapped, creating one of the busiest and most festive shopping periods of the spring season. Instacart took a look at what customers in Washington and across the country added to their carts during Easter week (April 14-20, 2025) and the week leading up to Passover (April 7-13, 2025) to see how Americans celebrated.
Here's an overview from Instacart of what hopped to the top.
Key Takeaways:
Reese's Peanut Butter Eggs are the undisputed basket MVP. They ranked as the top-selling Easter candy nationwide for the fourth year in a row, leading Instacart's Top 10 list.
Jelly beans have their Easter moment. Jelly beans surged 863% above their yearly average during Easter week — one of the largest candy spikes of the season.
Easter weekend doubles as a spring reset. Gardening categories like soil (up 128%), mulch (133%), annual plants (157%), and fertilizer (124%) all saw significant lifts, showing that many people use the holiday as a launchpad for spring refresh projects.
Easter décor dominates the holiday surge. Easter décor, including items like Easter baskets, grass, and plastic eggs, skyrocketed 2,742% above its yearly average during Easter week, making it the single biggest seasonal spike.
Passover prep is rooted in tradition. In the week leading up to Passover, matzah jumped 1,239% above its yearly average, while gefilte fish (742%), and matzo ball mixes (673%) also surged.
Instacart
Easter Week: Candy, Lamb — and a Side of Mulch
During the seven-day period ending on Easter Sunday, several categories surged far beyond their typical share of sales throughout the year.
Easter dinner centerpieces had a major moment, alongside candy-filled baskets and playful toys. As families headed outdoors for egg hunts after a long winter, gardening supplies also surged, signaling the unofficial kickoff to green thumb season.
Instacart
Easter baskets went big
It's good news for the kiddos. The spike in sidewalk chalk and bubble wands signals that backyard season has officially begun.
Instacart
The Top 10 Easter Candies in America
When it comes to Easter basket-building, one candy reigned supreme.
During Easter week, Reese's Peanut Butter Eggs ranked as the top-selling Easter candy by item share for the fourth year in a row.
Chocolate clearly dominates carts, but the presence of Sour Patch Kids, Starburst Jelly Beans, and Nerds shows that sour and fruity favorites still hold their own.
Instacart
Reese's Dominates — But Not Every State Agrees
Perhaps unsurprisingly, when we mapped the top-selling Easter candy by item share in each state, Reese's Peanut Butter Eggs topped the charts in 38 states, including Washington, reinforcing its status as the undisputed MVP of Easter baskets.
However, 11 states (plus Washington, D.C.) opted for something else.
The Milk Chocolate Loyalists
States along both coasts as well as the Dakotas showed their love for Hershey's Milk Chocolate as their top candy:
California
Connecticut
Delaware
Maryland
Nevada
New Jersey
North Carolina
North Dakota
South Dakota
The Bunny Believers
In Hawai'i and Maine, customers favored the seasonal classic Lindt Gold Bunny Milk Chocolate.
The Cup Crowd
And in Washington, D.C. and South Carolina, customers preferred Reese's Peanut Butter Cups over the popular Easter egg-shaped version. Either way, it's clear Reese's peanut butter perfection is key for holiday enjoyment.
Where Jelly Beans and Chocolate Bunnies Shine
Beyond overall top candies, we also looked at how strongly certain Easter staples over-indexed in each state compared to the national average, and two classics stood out: jelly beans and chocolate bunnies.
Instacart
The Jelly Bean Belt
Jelly beans surged nationally during Easter week, up 863% above their yearly average, but some states embraced them even more enthusiastically.
Washington ordered 4% less jelly beans as a share of candy items compared to the national average, ranking as the #17 least among all states.
The biggest jelly bean fans were concentrated in the Midwest and Upper Plains:
Iowa (39% over national average)
North Dakota (37%)
Minnesota (37%)
Vermont (35%)
Wisconsin (35%)
Ohio (31%)
Michigan (30%)
In these states, jelly beans made up a significantly larger share of candy purchases than the national average, reinforcing their status as an Easter essential.
Meanwhile, states like California (21% below the national average), Hawai'i (22%), and D.C. (39%) purchased jelly beans at notably lower rates than the national average.
Instacart
Chocolate Bunny Strongholds
Chocolate bunnies also saw clear regional differences. Washington ordered 0% more chocolate bunnies as a share of candy items compared to the national average, ranking as the #28 most among all states. The biggest chocolate bunny enthusiasts included:
Hawai'i (68% above national average)
Vermont (55%)
Rhode Island (50%)
Maine (50%)
New Hampshire (31%)
In these states, chocolate bunnies made up a significantly higher share of candy purchases compared to the national average.
One of the more surprising findings was Hawai'i topping the country for chocolate bunny purchases. The state typically under-indexes on highly seasonal purchases, so seeing it lead on such an iconic Easter item really stands out. What makes the trend even more interesting is that Hawai'i ordered jelly beans less often than average — suggesting that in the Aloha State, chocolate bunnies are in and jelly beans are out.
On the other end of the spectrum, Utah (31% below the national average), D.C. (30%), and Nevada (25%) ordered chocolate bunnies the least often, showing that while bunnies may be iconic, they are not equally beloved everywhere.
Utah's chocolate bunny demand also caught attention. The state is usually at the forefront of seasonal shopping trends, so its lower-than-average demand for chocolate bunnies is a notable departure. For a state that often embraces holiday moments, the inverse this year stands out.
Instacart
Passover Prep: Seder Staples Surge
Looking at the week leading up to Passover (April 7-13, 2025), traditional Seder essentials rose sharply compared to their typical yearly share with matzah (+1,239%), matzo ball mixes (+673%), gefilte fish (+742%), and horseradish root (+1,120%).
Purchases of these key Passover staples follow a sharply seasonal pattern, with their most significant surge of the year occurring in the week leading up to Passover. Compared to their typical baseline, demand for these items skyrockets during the holiday, far outpacing any other point in the calendar year. While smaller lifts appear again around Rosh Hashanah and Hanukkah, those increases are modest in comparison, underscoring Passover as the clear peak moment for these traditional foods.
Baskets, Blooms and Seder Tables Await
With both holidays fast approaching, customers are leaning into the traditions and seasonal favorites that define spring.
]]>urn:uuid:a49a7391-eca2-42df-b7f3-dc85404f7772Cities with the fastest-growing home prices in Washington2026-03-31T10:28:54-04:002026-03-31T10:28:54-04:00StackerWashingtonStacker compiled a list of cities with the fastest-growing home prices in Washington using data from Zillow.]]>
ungvar // Shutterstock
Cities with the fastest-growing home prices in Washington
The real estate frenzy spurred by the coronavirus pandemic continues, though at a slower pace. Buyers are still competing for a limited supply of housing, driving up prices for affordable properties.
The typical home value in the United States was $361,371 in February, 0.4% higher than the year before.
Increasing mortgage rates have slowed growth, with prices even declining in some places. But some areas are still seeing price jumps compared to the year before.
Stacker compiled a list of cities with the fastest-growing home prices in Washington using data from Zillow. Cities are ranked by the dollar change in the Zillow Home Values Index for all homes from the 12 months ending February 2026. The charts in this story were created automatically using Matplotlib. Data was available for 50 cities and towns in Washington.
Stacker
#50. Port Orchard
- Typical home value: $550,323 - 1-year price change: +$11,042 (+2.0%) - 5-year price change: +$98,527 (+21.8%) - Metro area: Bremerton-Silverdale-Port Orchard, WA
Stacker
#49. Valley
- Typical home value: $308,779 - 1-year price change: +$11,540 (+3.9%) - 5-year price change: +$66,398 (+27.4%) - Metro area: Spokane-Spokane Valley, WA
Stacker
#48. Harrah
- Typical home value: $301,512 - 1-year price change: +$11,598 (+4.0%) - 5-year price change: +$57,500 (+23.6%) - Metro area: Yakima, WA
Stacker
#47. Bucoda
- Typical home value: $307,799 - 1-year price change: +$11,674 (+3.9%) - 5-year price change: +$78,774 (+34.4%) - Metro area: Olympia-Lacey-Tumwater, WA
Stacker
#46. Bainbridge Island
- Typical home value: $1,146,582 - 1-year price change: +$11,699 (+1.0%) - 5-year price change: +$229,129 (+25.0%) - Metro area: Bremerton-Silverdale-Port Orchard, WA
Stacker
#45. Lynden
- Typical home value: $616,773 - 1-year price change: +$11,847 (+2.0%) - 5-year price change: +$147,774 (+31.5%) - Metro area: Bellingham, WA
Stacker
#44. Rockford
- Typical home value: $396,982 - 1-year price change: +$11,869 (+3.1%) - 5-year price change: +$92,432 (+30.4%) - Metro area: Spokane-Spokane Valley, WA
Stacker
#43. Coulee City
- Typical home value: $298,868 - 1-year price change: +$11,876 (+4.1%) - 5-year price change: +$83,509 (+38.8%) - Metro area: Wenatchee, WA
Stacker
#42. Chehalis
- Typical home value: $468,469 - 1-year price change: +$12,004 (+2.6%) - 5-year price change: +$112,594 (+31.6%) - Metro area: Centralia, WA
Stacker
#41. Ilwaco
- Typical home value: $388,460 - 1-year price change: +$12,192 (+3.2%) - 5-year price change: +$86,534 (+28.7%) - Metro area: not in a metro area
Stacker
#40. Thorp
- Typical home value: $462,877 - 1-year price change: +$12,296 (+2.7%) - 5-year price change: +$100,919 (+27.9%) - Metro area: Ellensburg, WA
Stacker
#39. Outlook
- Typical home value: $355,627 - 1-year price change: +$12,371 (+3.6%) - 5-year price change: +$84,253 (+31.0%) - Metro area: Yakima, WA
Stacker
#38. Silver Creek
- Typical home value: $489,448 - 1-year price change: +$12,529 (+2.6%) - 5-year price change: +$130,395 (+36.3%) - Metro area: Centralia, WA
Stacker
#37. Rock Island
- Typical home value: $429,229 - 1-year price change: +$13,039 (+3.1%) - 5-year price change: +$115,403 (+36.8%) - Metro area: Wenatchee, WA
Stacker
#36. Tumtum
- Typical home value: $330,446 - 1-year price change: +$13,478 (+4.3%) - 5-year price change: +$72,491 (+28.1%) - Metro area: Spokane-Spokane Valley, WA
Stacker
#35. Coupeville
- Typical home value: $622,347 - 1-year price change: +$13,841 (+2.3%) - 5-year price change: +$127,027 (+25.6%) - Metro area: Oak Harbor, WA
Stacker
#34. Granger
- Typical home value: $305,246 - 1-year price change: +$14,007 (+4.8%) - 5-year price change: +$65,852 (+27.5%) - Metro area: Yakima, WA
Stacker
#33. Mansfield
- Typical home value: $226,705 - 1-year price change: +$14,130 (+6.6%) - 5-year price change: +$56,473 (+33.2%) - Metro area: Wenatchee, WA
Stacker
#32. Winlock
- Typical home value: $447,592 - 1-year price change: +$14,143 (+3.3%) - 5-year price change: +$145,192 (+48.0%) - Metro area: Centralia, WA
Stacker
#31. South Bend
- Typical home value: $309,309 - 1-year price change: +$14,365 (+4.9%) - 5-year price change: +$83,864 (+37.2%) - Metro area: not in a metro area
Stacker
#30. Coulee Dam
- Typical home value: $237,661 - 1-year price change: +$15,111 (+6.8%) - 5-year price change: +$62,877 (+36.0%) - Metro area: Wenatchee, WA
Stacker
#29. Sumas
- Typical home value: $490,954 - 1-year price change: +$15,267 (+3.2%) - 5-year price change: +$88,735 (+22.1%) - Metro area: Bellingham, WA
Stacker
#28. Waterville
- Typical home value: $299,266 - 1-year price change: +$15,603 (+5.5%) - 5-year price change: +$58,503 (+24.3%) - Metro area: Wenatchee, WA
Stacker
#27. Port Townsend
- Typical home value: $627,866 - 1-year price change: +$15,635 (+2.6%) - 5-year price change: +$138,440 (+28.3%) - Metro area: not in a metro area
Stacker
#26. Packwood
- Typical home value: $444,022 - 1-year price change: +$16,017 (+3.7%) - 5-year price change: +$173,610 (+64.2%) - Metro area: Centralia, WA
Stacker
#25. Ford
- Typical home value: $278,169 - 1-year price change: +$16,305 (+6.2%) - 5-year price change: +$65,207 (+30.6%) - Metro area: Spokane-Spokane Valley, WA
Stacker
#24. Toledo
- Typical home value: $491,968 - 1-year price change: +$16,412 (+3.5%) - 5-year price change: +$128,125 (+35.2%) - Metro area: Centralia, WA
Stacker
#23. Lyman
- Typical home value: $453,594 - 1-year price change: +$16,449 (+3.8%) - 5-year price change: +$98,541 (+27.8%) - Metro area: Mount Vernon-Anacortes, WA
Stacker
#22. Ruston
- Typical home value: $741,805 - 1-year price change: +$16,569 (+2.3%) - 5-year price change: +$181,119 (+32.3%) - Metro area: Seattle-Tacoma-Bellevue, WA
Stacker
#21. Clayton
- Typical home value: $411,503 - 1-year price change: +$16,772 (+4.2%) - 5-year price change: +$101,745 (+32.8%) - Metro area: Spokane-Spokane Valley, WA
Stacker
#20. Napavine
- Typical home value: $414,258 - 1-year price change: +$17,149 (+4.3%) - 5-year price change: +$106,054 (+34.4%) - Metro area: Centralia, WA
Stacker
#19. Indianola
- Typical home value: $670,136 - 1-year price change: +$17,244 (+2.6%) - 5-year price change: +$113,527 (+20.4%) - Metro area: Bremerton-Silverdale-Port Orchard, WA
Stacker
#18. Springdale
- Typical home value: $306,920 - 1-year price change: +$17,347 (+6.0%) - 5-year price change: +$82,305 (+36.6%) - Metro area: Spokane-Spokane Valley, WA
Stacker
#17. Point Roberts
- Typical home value: $386,970 - 1-year price change: +$17,646 (+4.8%) - 5-year price change: +$63,893 (+19.8%) - Metro area: Bellingham, WA
Stacker
#16. Metaline Falls
- Typical home value: $257,379 - 1-year price change: +$17,814 (+7.4%) - 5-year price change: +$68,016 (+35.9%) - Metro area: not in a metro area
Stacker
#15. Index
- Typical home value: $487,694 - 1-year price change: +$18,498 (+3.9%) - 5-year price change: +$134,208 (+38.0%) - Metro area: Seattle-Tacoma-Bellevue, WA
Stacker
#14. Fox Island
- Typical home value: $1,045,325 - 1-year price change: +$19,009 (+1.9%) - 5-year price change: +$269,008 (+34.7%) - Metro area: Seattle-Tacoma-Bellevue, WA
Stacker
#13. Grayland
- Typical home value: $277,528 - 1-year price change: +$19,099 (+7.4%) - 5-year price change: +$59,332 (+27.2%) - Metro area: Aberdeen, WA
Stacker
#12. Cashmere
- Typical home value: $526,507 - 1-year price change: +$19,573 (+3.9%) - 5-year price change: +$93,144 (+21.5%) - Metro area: Wenatchee, WA
Stacker
#11. Republic
- Typical home value: $272,630 - 1-year price change: +$20,371 (+8.1%) - 5-year price change: +$29,064 (+11.9%) - Metro area: not in a metro area
Stacker
#10. Tokeland
- Typical home value: $281,023 - 1-year price change: +$20,433 (+7.8%) - 5-year price change: +$66,028 (+30.7%) - Metro area: not in a metro area
Stacker
#9. Seabeck
- Typical home value: $677,214 - 1-year price change: +$21,802 (+3.3%) - 5-year price change: +$137,766 (+25.5%) - Metro area: Bremerton-Silverdale-Port Orchard, WA
Stacker
#8. Cougar
- Typical home value: $309,498 - 1-year price change: +$24,713 (+8.7%) - 5-year price change: +$46,131 (+17.5%) - Metro area: Longview, WA
Stacker
#7. Ethel
- Typical home value: $556,875 - 1-year price change: +$25,003 (+4.7%) - 5-year price change: +$147,307 (+36.0%) - Metro area: Centralia, WA
Stacker
#6. Skamokawa
- Typical home value: $338,108 - 1-year price change: +$25,598 (+8.2%) - 5-year price change: +$96,303 (+39.8%) - Metro area: not in a metro area
Stacker
#5. Bow
- Typical home value: $821,981 - 1-year price change: +$32,495 (+4.1%) - 5-year price change: +$203,210 (+32.8%) - Metro area: Mount Vernon-Anacortes, WA
Stacker
#4. Ariel
- Typical home value: $551,865 - 1-year price change: +$34,201 (+6.6%) - 5-year price change: +$165,171 (+42.7%) - Metro area: Longview, WA
Stacker
#3. Pomeroy
- Typical home value: $251,522 - 1-year price change: +$34,361 (+15.8%) - 5-year price change: +$85,355 (+51.4%) - Metro area: not in a metro area
Stacker
#2. Eltopia
- Typical home value: $723,457 - 1-year price change: +$35,604 (+5.2%) - 5-year price change: +$209,442 (+40.7%) - Metro area: Kennewick-Richland, WA
Stacker
#1. Hunts Point
- Typical home value: $8,015,839 - 1-year price change: +$247,457 (+3.2%) - 5-year price change: +$2,110,779 (+35.7%) - Metro area: Seattle-Tacoma-Bellevue, WA
]]>urn:uuid:1b6d0c7a-88ef-41f1-a049-16f20d6dc32fCities with the fastest-growing home prices in the Yakima metro area2026-03-24T17:04:45-04:002026-03-24T17:04:45-04:00StackerYakimaStacker compiled a list of cities with the fastest growing home prices in the Yakima, WA metro using data from Zillow.]]>
Arina P Habich // Shutterstock
Cities with the fastest-growing home prices in the Yakima metro area
The real estate frenzy spurred by the coronavirus pandemic continues, though at a slower pace. Buyers are still competing for a limited supply of housing, driving up prices for affordable properties.
The typical home value in the United States was $361,371 in February, 0.4% higher than the year before.
Increasing mortgage rates have slowed growth, with prices even declining in some places. But some areas are still seeing price jumps compared to the year before.
Stacker compiled a list of cities with the most expensive homes in the Yakima, WA metro area using data from Zillow. Charts show the monthly typical home value since January 2018.
Stacker
#18. Wapato, WA
- 1-year price change: -$2,090 (-0.8%) - 5-year price change: +$48,101 (+21.1%) - Typical home value: $276,588 (#15 most expensive city in metro)
Stacker
#17. Toppenish, WA
- 1-year price change: -$1,855 (-0.7%) - 5-year price change: +$52,636 (+24.4%) - Typical home value: $268,575 (#17 most expensive city in metro)
Stacker
#16. Glenwood, WA
- 1-year price change: -$579 (-0.2%) - 5-year price change: +$48,928 (+15.6%) - Typical home value: $362,993 (#4 most expensive city in metro)
Stacker
#15. Cowiche, WA
- 1-year price change: -$431 (-0.1%) - 5-year price change: +$32,616 (+11.0%) - Typical home value: $327,967 (#9 most expensive city in metro)
Stacker
#14. Union Gap, WA
- 1-year price change: +$2,162 (+0.9%) - 5-year price change: +$57,880 (+30.1%) - Typical home value: $250,297 (#18 most expensive city in metro)
Stacker
#13. Tieton, WA
- 1-year price change: +$3,481 (+1.0%) - 5-year price change: +$59,575 (+21.1%) - Typical home value: $342,169 (#7 most expensive city in metro)
Stacker
#12. Grandview, WA
- 1-year price change: +$3,937 (+1.2%) - 5-year price change: +$69,452 (+26.2%) - Typical home value: $334,049 (#8 most expensive city in metro)
Stacker
#11. Moxee, WA
- 1-year price change: +$4,800 (+1.2%) - 5-year price change: +$91,839 (+30.1%) - Typical home value: $396,479 (#2 most expensive city in metro)
Stacker
#10. Yakima, WA
- 1-year price change: +$5,677 (+1.6%) - 5-year price change: +$67,004 (+23.3%) - Typical home value: $355,051 (#6 most expensive city in metro)
Stacker
#9. Zillah, WA
- 1-year price change: +$6,729 (+1.8%) - 5-year price change: +$79,508 (+26.9%) - Typical home value: $374,696 (#3 most expensive city in metro)
Stacker
#8. Sunnyside, WA
- 1-year price change: +$7,287 (+2.4%) - 5-year price change: +$74,241 (+30.6%) - Typical home value: $316,636 (#10 most expensive city in metro)
Stacker
#7. Selah, WA
- 1-year price change: +$7,569 (+1.8%) - 5-year price change: +$92,681 (+27.4%) - Typical home value: $431,456 (#1 most expensive city in metro)
Stacker
#6. White Swan, WA
- 1-year price change: +$7,615 (+2.6%) - 5-year price change: +$47,637 (+19.1%) - Typical home value: $296,999 (#14 most expensive city in metro)
Stacker
#5. Naches, WA
- 1-year price change: +$8,504 (+2.8%) - 5-year price change: +$60,080 (+23.7%) - Typical home value: $313,621 (#11 most expensive city in metro)
Stacker
#4. Mabton, WA
- 1-year price change: +$9,875 (+3.7%) - 5-year price change: +$59,346 (+27.7%) - Typical home value: $273,457 (#16 most expensive city in metro)
Stacker
#3. Harrah, WA
- 1-year price change: +$11,598 (+4.0%) - 5-year price change: +$57,500 (+23.6%) - Typical home value: $301,512 (#13 most expensive city in metro)
Stacker
#2. Outlook, WA
- 1-year price change: +$12,371 (+3.6%) - 5-year price change: +$84,253 (+31.0%) - Typical home value: $355,627 (#5 most expensive city in metro)
Stacker
#1. Granger, WA
- 1-year price change: +$14,007 (+4.8%) - 5-year price change: +$65,852 (+27.5%) - Typical home value: $305,246 (#12 most expensive city in metro)
]]>urn:uuid:f13833bd-11e5-4cf3-9bff-7cb78f478cabCities with the fastest-growing home prices in the Wenatchee metro area2026-03-24T17:04:40-04:002026-03-24T17:04:40-04:00StackerWenatcheeStacker compiled a list of cities with the fastest growing home prices in the Wenatchee, WA metro using data from Zillow.]]>
4 PM production // Shutterstock
Cities with the fastest-growing home prices in the Wenatchee metro area
The real estate frenzy spurred by the coronavirus pandemic continues, though at a slower pace. Buyers are still competing for a limited supply of housing, driving up prices for affordable properties.
The typical home value in the United States was $361,371 in February, 0.4% higher than the year before.
Increasing mortgage rates have slowed growth, with prices even declining in some places. But some areas are still seeing price jumps compared to the year before.
Stacker compiled a list of cities with the most expensive homes in the Wenatchee, WA metro area using data from Zillow. Charts show the monthly typical home value since January 2018.
Stacker
#20. Chelan, WA
- 1-year price change: -$20,435 (-4.0%) - 5-year price change: +$39,076 (+8.5%) - Typical home value: $496,510 (#8 most expensive city in metro)
Stacker
#19. Grand Coulee, WA
- 1-year price change: -$14,705 (-5.4%) - 5-year price change: +$48,001 (+22.8%) - Typical home value: $258,785 (#17 most expensive city in metro)
Stacker
#18. Carlton, WA
- 1-year price change: -$13,331 (-2.7%) - 5-year price change: +$64,273 (+15.4%) - Typical home value: $482,205 (#11 most expensive city in metro)
Stacker
#17. Manson, WA
- 1-year price change: -$11,838 (-1.6%) - 5-year price change: +$146,127 (+25.2%) - Typical home value: $726,584 (#1 most expensive city in metro)
Stacker
#16. Winthrop, WA
- 1-year price change: -$10,382 (-1.7%) - 5-year price change: +$141,879 (+30.8%) - Typical home value: $603,053 (#4 most expensive city in metro)
Stacker
#15. Orondo, WA
- 1-year price change: -$9,573 (-1.4%) - 5-year price change: +$192,436 (+39.6%) - Typical home value: $677,828 (#2 most expensive city in metro)
Stacker
#14. Leavenworth, WA
- 1-year price change: -$4,730 (-0.7%) - 5-year price change: +$98,762 (+17.7%) - Typical home value: $655,765 (#3 most expensive city in metro)
Stacker
#13. Peshastin, WA
- 1-year price change: +$4,506 (+0.9%) - 5-year price change: +$59,794 (+13.7%) - Typical home value: $494,935 (#9 most expensive city in metro)
Stacker
#12. East Wenatchee, WA
- 1-year price change: +$5,263 (+1.1%) - 5-year price change: +$99,525 (+24.6%) - Typical home value: $503,877 (#7 most expensive city in metro)
Stacker
#11. Wenatchee, WA
- 1-year price change: +$5,771 (+1.2%) - 5-year price change: +$95,457 (+24.3%) - Typical home value: $488,227 (#10 most expensive city in metro)
Stacker
#10. Bridgeport, WA
- 1-year price change: +$7,949 (+3.5%) - 5-year price change: +$30,857 (+15.0%) - Typical home value: $236,168 (#19 most expensive city in metro)
Stacker
#9. Brewster, WA
- 1-year price change: +$8,575 (+2.9%) - 5-year price change: +$55,787 (+22.0%) - Typical home value: $308,928 (#14 most expensive city in metro)
Stacker
#8. Entiat, WA
- 1-year price change: +$10,346 (+2.3%) - 5-year price change: +$82,823 (+22.1%) - Typical home value: $456,940 (#12 most expensive city in metro)
Stacker
#7. Malaga, WA
- 1-year price change: +$10,864 (+2.2%) - 5-year price change: +$88,656 (+21.0%) - Typical home value: $510,034 (#6 most expensive city in metro)
Stacker
#6. Coulee City, WA
- 1-year price change: +$11,876 (+4.1%) - 5-year price change: +$83,509 (+38.8%) - Typical home value: $298,868 (#16 most expensive city in metro)
Stacker
#5. Rock Island, WA
- 1-year price change: +$13,039 (+3.1%) - 5-year price change: +$115,403 (+36.8%) - Typical home value: $429,229 (#13 most expensive city in metro)
Stacker
#4. Mansfield, WA
- 1-year price change: +$14,130 (+6.6%) - 5-year price change: +$56,473 (+33.2%) - Typical home value: $226,705 (#20 most expensive city in metro)
Stacker
#3. Coulee Dam, WA
- 1-year price change: +$15,111 (+6.8%) - 5-year price change: +$62,877 (+36.0%) - Typical home value: $237,661 (#18 most expensive city in metro)
Stacker
#2. Waterville, WA
- 1-year price change: +$15,603 (+5.5%) - 5-year price change: +$58,503 (+24.3%) - Typical home value: $299,266 (#15 most expensive city in metro)
Stacker
#1. Cashmere, WA
- 1-year price change: +$19,573 (+3.9%) - 5-year price change: +$93,144 (+21.5%) - Typical home value: $526,507 (#5 most expensive city in metro)
]]>urn:uuid:af4beab4-0d31-4294-8f8f-5e1e8a525c36Cities with the fastest-growing home prices in the Walla Walla metro area2026-03-24T17:04:36-04:002026-03-24T17:04:36-04:00StackerWalla WallaStacker compiled a list of cities with the fastest growing home prices in the Walla Walla, WA metro using data from Zillow.]]>
ungvar // Shutterstock
Cities with the fastest-growing home prices in the Walla Walla metro area
The real estate frenzy spurred by the coronavirus pandemic continues, though at a slower pace. Buyers are still competing for a limited supply of housing, driving up prices for affordable properties.
The typical home value in the United States was $361,371 in February, 0.4% higher than the year before.
Increasing mortgage rates have slowed growth, with prices even declining in some places. But some areas are still seeing price jumps compared to the year before.
Stacker compiled a list of cities with the most expensive homes in the Walla Walla, WA metro area using data from Zillow. Charts show the monthly typical home value since January 2018.
Stacker
#6. Touchet, WA
- 1-year price change: -$5,825 (-1.0%) - 5-year price change: +$155,972 (+37.7%) - Typical home value: $569,869 (#1 most expensive city in metro)
Stacker
#5. College Place, WA
- 1-year price change: +$2,405 (+0.6%) - 5-year price change: +$87,582 (+28.2%) - Typical home value: $398,551 (#5 most expensive city in metro)
Stacker
#4. Burbank, WA
- 1-year price change: +$5,511 (+1.2%) - 5-year price change: +$119,981 (+34.8%) - Typical home value: $464,475 (#2 most expensive city in metro)
Stacker
#3. Walla Walla, WA
- 1-year price change: +$7,340 (+1.8%) - 5-year price change: +$101,138 (+33.3%) - Typical home value: $404,890 (#4 most expensive city in metro)
Stacker
#2. Waitsburg, WA
- 1-year price change: +$7,904 (+2.2%) - 5-year price change: +$78,413 (+27.6%) - Typical home value: $362,563 (#6 most expensive city in metro)
Stacker
#1. Prescott, WA
- 1-year price change: +$9,155 (+2.3%) - 5-year price change: +$100,657 (+32.3%) - Typical home value: $412,517 (#3 most expensive city in metro)
]]>urn:uuid:09a00925-f8ac-4c3b-8e53-fceaf4c60e19Cities with the fastest-growing home prices in the Spokane metro area2026-03-24T17:04:20-04:002026-03-24T17:04:20-04:00StackerSpokaneStacker compiled a list of cities with the fastest growing home prices in the Spokane-Spokane Valley, WA metro using data from Zillow.]]>
4 PM production // Shutterstock
Cities with the fastest-growing home prices in the Spokane metro area
The real estate frenzy spurred by the coronavirus pandemic continues, though at a slower pace. Buyers are still competing for a limited supply of housing, driving up prices for affordable properties.
The typical home value in the United States was $361,371 in February, 0.4% higher than the year before.
Increasing mortgage rates have slowed growth, with prices even declining in some places. But some areas are still seeing price jumps compared to the year before.
Stacker compiled a list of cities with the most expensive homes in the Spokane-Spokane Valley, WA metro area using data from Zillow. Charts show the monthly typical home value since January 2018.
Stacker
#30. Rice, WA
- 1-year price change: -$3,361 (-0.9%) - 5-year price change: +$42,574 (+13.7%) - Typical home value: $353,780 (#23 most expensive city in metro)
Stacker
#29. Deer Park, WA
- 1-year price change: -$795 (-0.2%) - 5-year price change: +$98,106 (+27.4%) - Typical home value: $456,299 (#11 most expensive city in metro)
Stacker
#28. Valleyford, WA
- 1-year price change: -$662 (-0.1%) - 5-year price change: +$144,084 (+27.2%) - Typical home value: $674,717 (#2 most expensive city in metro)
Stacker
#27. Spokane, WA
- 1-year price change: -$157 (-0.0%) - 5-year price change: +$82,176 (+26.7%) - Typical home value: $389,884 (#19 most expensive city in metro)
Stacker
#26. Cheney, WA
- 1-year price change: +$1,070 (+0.3%) - 5-year price change: +$88,104 (+26.9%) - Typical home value: $415,773 (#14 most expensive city in metro)
Stacker
#25. Nine Mile Falls, WA
- 1-year price change: +$1,732 (+0.3%) - 5-year price change: +$125,066 (+31.0%) - Typical home value: $528,651 (#7 most expensive city in metro)
Stacker
#24. Spokane Valley, WA
- 1-year price change: +$2,385 (+0.6%) - 5-year price change: +$90,077 (+28.7%) - Typical home value: $404,483 (#16 most expensive city in metro)
Stacker
#23. Chattaroy, WA
- 1-year price change: +$2,668 (+0.5%) - 5-year price change: +$119,363 (+26.5%) - Typical home value: $570,627 (#4 most expensive city in metro)
Stacker
#22. Airway Heights, WA
- 1-year price change: +$3,535 (+1.0%) - 5-year price change: +$91,180 (+32.5%) - Typical home value: $371,921 (#21 most expensive city in metro)
Stacker
#21. Latah, WA
- 1-year price change: +$4,162 (+1.3%) - 5-year price change: +$55,064 (+20.2%) - Typical home value: $327,470 (#28 most expensive city in metro)
Stacker
#20. Liberty Lake, WA
- 1-year price change: +$4,357 (+0.8%) - 5-year price change: +$126,257 (+29.5%) - Typical home value: $554,867 (#5 most expensive city in metro)
Stacker
#19. Fairfield, WA
- 1-year price change: +$5,236 (+1.8%) - 5-year price change: +$58,426 (+25.2%) - Typical home value: $290,677 (#31 most expensive city in metro)
Stacker
#18. Kettle Falls, WA
- 1-year price change: +$6,149 (+2.3%) - 5-year price change: +$51,718 (+23.9%) - Typical home value: $268,150 (#33 most expensive city in metro)
Stacker
#17. Mead, WA
- 1-year price change: +$6,246 (+1.3%) - 5-year price change: +$121,857 (+31.7%) - Typical home value: $505,734 (#8 most expensive city in metro)
Stacker
#16. Loon Lake, WA
- 1-year price change: +$6,352 (+1.6%) - 5-year price change: +$96,433 (+31.8%) - Typical home value: $399,632 (#17 most expensive city in metro)
Stacker
#15. Elk, WA
- 1-year price change: +$6,831 (+1.5%) - 5-year price change: +$88,959 (+23.0%) - Typical home value: $475,189 (#10 most expensive city in metro)
Stacker
#14. Newman Lake, WA
- 1-year price change: +$8,064 (+1.7%) - 5-year price change: +$117,954 (+31.8%) - Typical home value: $489,355 (#9 most expensive city in metro)
Stacker
#13. Medical Lake, WA
- 1-year price change: +$8,409 (+2.0%) - 5-year price change: +$100,091 (+31.1%) - Typical home value: $422,409 (#13 most expensive city in metro)
Stacker
#12. Colville, WA
- 1-year price change: +$8,789 (+2.8%) - 5-year price change: +$90,202 (+38.0%) - Typical home value: $327,804 (#27 most expensive city in metro)
Stacker
#11. Northport, WA
- 1-year price change: +$9,014 (+3.8%) - 5-year price change: +$71,707 (+41.4%) - Typical home value: $245,061 (#34 most expensive city in metro)
Stacker
#10. Otis Orchards-East Farms, WA
- 1-year price change: +$9,597 (+2.2%) - 5-year price change: +$103,050 (+29.3%) - Typical home value: $454,789 (#12 most expensive city in metro)
Stacker
#9. Chewelah, WA
- 1-year price change: +$10,098 (+3.1%) - 5-year price change: +$75,326 (+28.4%) - Typical home value: $340,352 (#25 most expensive city in metro)
Stacker
#8. Addy, WA
- 1-year price change: +$10,313 (+3.0%) - 5-year price change: +$84,863 (+31.9%) - Typical home value: $351,246 (#24 most expensive city in metro)
Stacker
#7. Millwood, WA
- 1-year price change: +$10,590 (+3.0%) - 5-year price change: +$90,357 (+33.6%) - Typical home value: $358,892 (#22 most expensive city in metro)
Stacker
#6. Valley, WA
- 1-year price change: +$11,540 (+3.9%) - 5-year price change: +$66,398 (+27.4%) - Typical home value: $308,779 (#29 most expensive city in metro)
Stacker
#5. Rockford, WA
- 1-year price change: +$11,869 (+3.1%) - 5-year price change: +$92,432 (+30.4%) - Typical home value: $396,982 (#18 most expensive city in metro)
Stacker
#4. Tumtum, WA
- 1-year price change: +$13,478 (+4.3%) - 5-year price change: +$72,491 (+28.1%) - Typical home value: $330,446 (#26 most expensive city in metro)
Stacker
#3. Ford, WA
- 1-year price change: +$16,305 (+6.2%) - 5-year price change: +$65,207 (+30.6%) - Typical home value: $278,169 (#32 most expensive city in metro)
Stacker
#2. Clayton, WA
- 1-year price change: +$16,772 (+4.2%) - 5-year price change: +$101,745 (+32.8%) - Typical home value: $411,503 (#15 most expensive city in metro)
Stacker
#1. Springdale, WA
- 1-year price change: +$17,347 (+6.0%) - 5-year price change: +$82,305 (+36.6%) - Typical home value: $306,920 (#30 most expensive city in metro)
]]>urn:uuid:b1724835-fa90-48ca-a701-b89373737a17Cities with the fastest-growing home prices in the Seattle metro area2026-03-24T17:04:17-04:002026-03-24T17:04:17-04:00StackerSeattleStacker compiled a list of cities with the fastest growing home prices in the Seattle-Tacoma-Bellevue, WA metro using data from Zillow.]]>
FOTOGRIN // Shutterstock
Cities with the fastest-growing home prices in the Seattle metro area
The real estate frenzy spurred by the coronavirus pandemic continues, though at a slower pace. Buyers are still competing for a limited supply of housing, driving up prices for affordable properties.
The typical home value in the United States was $361,371 in February, 0.4% higher than the year before.
Increasing mortgage rates have slowed growth, with prices even declining in some places. But some areas are still seeing price jumps compared to the year before.
Stacker compiled a list of cities with the most expensive homes in the Seattle-Tacoma-Bellevue, WA metro area using data from Zillow. Charts show the monthly typical home value since January 2018.
Stacker
#30. Buckley, WA
- 1-year price change: -$3,368 (-0.5%) - 5-year price change: +$135,729 (+26.3%) - Typical home value: $651,743 (#53 most expensive city in metro)
Stacker
#29. Spanaway, WA
- 1-year price change: -$3,356 (-0.7%) - 5-year price change: +$99,034 (+24.4%) - Typical home value: $504,514 (#86 most expensive city in metro)
Stacker
#28. Enumclaw, WA
- 1-year price change: -$2,875 (-0.4%) - 5-year price change: +$139,281 (+26.2%) - Typical home value: $670,898 (#49 most expensive city in metro)
Stacker
#27. Sultan, WA
- 1-year price change: -$2,765 (-0.5%) - 5-year price change: +$120,523 (+27.4%) - Typical home value: $559,588 (#75 most expensive city in metro)
Stacker
#26. Edgewood, WA
- 1-year price change: -$2,352 (-0.3%) - 5-year price change: +$135,333 (+22.8%) - Typical home value: $729,984 (#41 most expensive city in metro)
Stacker
#25. Dupont, WA
- 1-year price change: -$1,620 (-0.3%) - 5-year price change: +$98,940 (+21.9%) - Typical home value: $550,256 (#79 most expensive city in metro)
Stacker
#24. Newcastle, WA
- 1-year price change: -$1,606 (-0.1%) - 5-year price change: +$425,134 (+43.7%) - Typical home value: $1,397,715 (#10 most expensive city in metro)
Stacker
#23. Darrington, WA
- 1-year price change: -$1,529 (-0.4%) - 5-year price change: +$112,779 (+35.8%) - Typical home value: $427,612 (#95 most expensive city in metro)
Stacker
#22. Eatonville, WA
- 1-year price change: -$1,083 (-0.2%) - 5-year price change: +$114,228 (+24.4%) - Typical home value: $583,045 (#67 most expensive city in metro)
Stacker
#21. Midland, WA
- 1-year price change: -$972 (-0.2%) - 5-year price change: +$96,771 (+25.2%) - Typical home value: $480,551 (#90 most expensive city in metro)
Stacker
#20. Gold Bar, WA
- 1-year price change: -$888 (-0.2%) - 5-year price change: +$113,217 (+32.0%) - Typical home value: $466,829 (#91 most expensive city in metro)
Stacker
#19. Frederickson, WA
- 1-year price change: +$105 (+0.0%) - 5-year price change: +$112,572 (+26.7%) - Typical home value: $534,493 (#80 most expensive city in metro)
Stacker
#18. Wilkeson, WA
- 1-year price change: +$762 (+0.2%) - 5-year price change: +$64,960 (+17.3%) - Typical home value: $439,465 (#94 most expensive city in metro)
Stacker
#17. Marysville, WA
- 1-year price change: +$948 (+0.2%) - 5-year price change: +$162,001 (+35.0%) - Typical home value: $625,314 (#57 most expensive city in metro)
Stacker
#16. Clover Creek, WA
- 1-year price change: +$966 (+0.2%) - 5-year price change: +$95,692 (+22.3%) - Typical home value: $524,230 (#83 most expensive city in metro)
Stacker
#15. Sumner, WA
- 1-year price change: +$1,716 (+0.3%) - 5-year price change: +$114,938 (+24.4%) - Typical home value: $585,632 (#66 most expensive city in metro)
Stacker
#14. Waller, WA
- 1-year price change: +$1,925 (+0.3%) - 5-year price change: +$107,420 (+22.7%) - Typical home value: $581,341 (#68 most expensive city in metro)
Stacker
#13. Snoqualmie Pass, WA
- 1-year price change: +$2,275 (+0.3%) - 5-year price change: +$292,304 (+56.0%) - Typical home value: $814,678 (#33 most expensive city in metro)
Stacker
#12. Ashford, WA
- 1-year price change: +$3,199 (+0.9%) - 5-year price change: +$106,714 (+40.8%) - Typical home value: $368,486 (#96 most expensive city in metro)
Stacker
#11. Gig Harbor, WA
- 1-year price change: +$4,971 (+0.6%) - 5-year price change: +$194,360 (+31.6%) - Typical home value: $810,287 (#35 most expensive city in metro)
Stacker
#10. Vaughn, WA
- 1-year price change: +$5,221 (+0.7%) - 5-year price change: +$154,910 (+27.9%) - Typical home value: $711,063 (#43 most expensive city in metro)
Stacker
#9. Normandy Park, WA
- 1-year price change: +$6,139 (+0.6%) - 5-year price change: +$246,795 (+31.9%) - Typical home value: $1,021,124 (#21 most expensive city in metro)
Stacker
#8. Carbonado, WA
- 1-year price change: +$6,656 (+1.3%) - 5-year price change: +$78,402 (+17.3%) - Typical home value: $532,016 (#81 most expensive city in metro)
Stacker
#7. Granite Falls, WA
- 1-year price change: +$8,481 (+1.5%) - 5-year price change: +$146,947 (+34.1%) - Typical home value: $578,156 (#71 most expensive city in metro)
Stacker
#6. Stanwood, WA
- 1-year price change: +$8,878 (+1.3%) - 5-year price change: +$173,443 (+32.5%) - Typical home value: $706,984 (#44 most expensive city in metro)
Stacker
#5. Arlington, WA
- 1-year price change: +$10,918 (+1.7%) - 5-year price change: +$167,975 (+34.2%) - Typical home value: $658,913 (#51 most expensive city in metro)
Stacker
#4. Ruston, WA
- 1-year price change: +$16,569 (+2.3%) - 5-year price change: +$181,119 (+32.3%) - Typical home value: $741,805 (#40 most expensive city in metro)
Stacker
#3. Index, WA
- 1-year price change: +$18,498 (+3.9%) - 5-year price change: +$134,208 (+38.0%) - Typical home value: $487,694 (#88 most expensive city in metro)
Stacker
#2. Fox Island, WA
- 1-year price change: +$19,009 (+1.9%) - 5-year price change: +$269,008 (+34.7%) - Typical home value: $1,045,325 (#18 most expensive city in metro)
Stacker
#1. Hunts Point, WA
- 1-year price change: +$247,457 (+3.2%) - 5-year price change: +$2,110,779 (+35.7%) - Typical home value: $8,015,839 (#1 most expensive city in metro)
]]>urn:uuid:dc91e71a-7a62-430f-9833-ae5d527322b9Cities with the fastest-growing home prices in the Olympia metro area2026-03-24T17:03:51-04:002026-03-24T17:03:51-04:00StackerOlympiaStacker compiled a list of cities with the fastest growing home prices in the Olympia-Lacey-Tumwater, WA metro using data from Zillow.]]>
Arina P Habich // Shutterstock
Cities with the fastest-growing home prices in the Olympia metro area
The real estate frenzy spurred by the coronavirus pandemic continues, though at a slower pace. Buyers are still competing for a limited supply of housing, driving up prices for affordable properties.
The typical home value in the United States was $361,371 in February, 0.4% higher than the year before.
Increasing mortgage rates have slowed growth, with prices even declining in some places. But some areas are still seeing price jumps compared to the year before.
Stacker compiled a list of cities with the most expensive homes in the Olympia-Lacey-Tumwater, WA metro area using data from Zillow. Charts show the monthly typical home value since January 2018.
Stacker
#8. Olympia, WA
- 1-year price change: +$228 (+0.0%) - 5-year price change: +$106,867 (+25.4%) - Typical home value: $527,202 (#1 most expensive city in metro)
Stacker
#7. Lacey, WA
- 1-year price change: +$925 (+0.2%) - 5-year price change: +$105,164 (+25.9%) - Typical home value: $511,129 (#3 most expensive city in metro)
Stacker
#6. Yelm, WA
- 1-year price change: +$1,969 (+0.4%) - 5-year price change: +$94,611 (+24.4%) - Typical home value: $482,985 (#7 most expensive city in metro)
Stacker
#5. Tumwater, WA
- 1-year price change: +$3,280 (+0.6%) - 5-year price change: +$106,752 (+25.8%) - Typical home value: $521,198 (#2 most expensive city in metro)
Stacker
#4. Tenino, WA
- 1-year price change: +$6,500 (+1.3%) - 5-year price change: +$109,142 (+27.7%) - Typical home value: $503,695 (#6 most expensive city in metro)
Stacker
#3. Rochester, WA
- 1-year price change: +$6,520 (+1.3%) - 5-year price change: +$114,856 (+29.2%) - Typical home value: $508,250 (#5 most expensive city in metro)
Stacker
#2. Rainier, WA
- 1-year price change: +$9,785 (+2.0%) - 5-year price change: +$133,492 (+35.5%) - Typical home value: $509,400 (#4 most expensive city in metro)
Stacker
#1. Bucoda, WA
- 1-year price change: +$11,674 (+3.9%) - 5-year price change: +$78,774 (+34.4%) - Typical home value: $307,799 (#8 most expensive city in metro)
]]>urn:uuid:b92cc0bb-c0af-4e11-a093-9a5478bed86fCities with the fastest-growing home prices in the Mount Vernon metro area2026-03-24T17:03:45-04:002026-03-24T17:03:45-04:00StackerMount VernonStacker compiled a list of cities with the fastest growing home prices in the Mount Vernon-Anacortes, WA metro using data from Zillow.]]>
FOTOGRIN // Shutterstock
Cities with the fastest-growing home prices in the Mount Vernon metro area
The real estate frenzy spurred by the coronavirus pandemic continues, though at a slower pace. Buyers are still competing for a limited supply of housing, driving up prices for affordable properties.
The typical home value in the United States was $361,371 in February, 0.4% higher than the year before.
Increasing mortgage rates have slowed growth, with prices even declining in some places. But some areas are still seeing price jumps compared to the year before.
Stacker compiled a list of cities with the most expensive homes in the Mount Vernon-Anacortes, WA metro area using data from Zillow. Charts show the monthly typical home value since January 2018.
Stacker
#9. La Conner, WA
- 1-year price change: -$12,491 (-2.7%) - 5-year price change: +$50,711 (+12.6%) - Typical home value: $454,253 (#6 most expensive city in metro)
Stacker
#8. Marblemount, WA
- 1-year price change: -$11,305 (-5.1%) - 5-year price change: +$32,626 (+18.4%) - Typical home value: $210,111 (#9 most expensive city in metro)
Stacker
#7. Sedro-Woolley, WA
- 1-year price change: +$1,660 (+0.3%) - 5-year price change: +$118,470 (+31.8%) - Typical home value: $491,503 (#5 most expensive city in metro)
Stacker
#6. Anacortes, WA
- 1-year price change: +$4,143 (+0.6%) - 5-year price change: +$155,002 (+27.7%) - Typical home value: $713,800 (#2 most expensive city in metro)
Stacker
#5. Concrete, WA
- 1-year price change: +$5,059 (+2.0%) - 5-year price change: +$53,176 (+26.5%) - Typical home value: $253,805 (#8 most expensive city in metro)
Stacker
#4. Burlington, WA
- 1-year price change: +$8,229 (+1.6%) - 5-year price change: +$128,667 (+31.8%) - Typical home value: $533,451 (#4 most expensive city in metro)
Stacker
#3. Mount Vernon, WA
- 1-year price change: +$11,002 (+1.9%) - 5-year price change: +$138,665 (+31.5%) - Typical home value: $579,528 (#3 most expensive city in metro)
Stacker
#2. Lyman, WA
- 1-year price change: +$16,449 (+3.8%) - 5-year price change: +$98,541 (+27.8%) - Typical home value: $453,594 (#7 most expensive city in metro)
Stacker
#1. Bow, WA
- 1-year price change: +$32,495 (+4.1%) - 5-year price change: +$203,210 (+32.8%) - Typical home value: $821,981 (#1 most expensive city in metro)
]]>urn:uuid:e479e47b-7386-4b81-83b1-082fa9e1c6c4Cities with the fastest-growing home prices in the Longview metro area2026-03-24T17:03:36-04:002026-03-24T17:03:36-04:00StackerLongviewStacker compiled a list of cities with the fastest growing home prices in the Longview, WA metro using data from Zillow.]]>
Konstantin L // Shutterstock
Cities with the fastest-growing home prices in the Longview metro area
The real estate frenzy spurred by the coronavirus pandemic continues, though at a slower pace. Buyers are still competing for a limited supply of housing, driving up prices for affordable properties.
The typical home value in the United States was $361,371 in February, 0.4% higher than the year before.
Increasing mortgage rates have slowed growth, with prices even declining in some places. But some areas are still seeing price jumps compared to the year before.
Stacker compiled a list of cities with the most expensive homes in the Longview, WA metro area using data from Zillow. Charts show the monthly typical home value since January 2018.
Stacker
#10. Ryderwood, WA
- 1-year price change: -$3,128 (-1.2%) - 5-year price change: +$59,504 (+30.0%) - Typical home value: $258,074 (#10 most expensive city in metro)
Stacker
#9. Toutle, WA
- 1-year price change: -$983 (-0.2%) - 5-year price change: +$130,084 (+35.6%) - Typical home value: $495,479 (#4 most expensive city in metro)
Stacker
#8. Castle Rock, WA
- 1-year price change: +$664 (+0.1%) - 5-year price change: +$98,938 (+26.8%) - Typical home value: $468,492 (#6 most expensive city in metro)
Stacker
#7. Longview, WA
- 1-year price change: +$1,126 (+0.3%) - 5-year price change: +$65,800 (+20.7%) - Typical home value: $383,772 (#7 most expensive city in metro)
Stacker
#6. Kelso, WA
- 1-year price change: +$1,498 (+0.4%) - 5-year price change: +$75,324 (+24.5%) - Typical home value: $382,455 (#8 most expensive city in metro)
Stacker
#5. Kalama, WA
- 1-year price change: +$1,682 (+0.3%) - 5-year price change: +$110,125 (+26.0%) - Typical home value: $532,931 (#3 most expensive city in metro)
Stacker
#4. Silverlake, WA
- 1-year price change: +$4,002 (+0.8%) - 5-year price change: +$105,121 (+28.2%) - Typical home value: $477,811 (#5 most expensive city in metro)
Stacker
#3. Woodland, WA
- 1-year price change: +$10,979 (+1.9%) - 5-year price change: +$123,900 (+27.1%) - Typical home value: $581,280 (#1 most expensive city in metro)
Stacker
#2. Cougar, WA
- 1-year price change: +$24,713 (+8.7%) - 5-year price change: +$46,131 (+17.5%) - Typical home value: $309,498 (#9 most expensive city in metro)
Stacker
#1. Ariel, WA
- 1-year price change: +$34,201 (+6.6%) - 5-year price change: +$165,171 (+42.7%) - Typical home value: $551,865 (#2 most expensive city in metro)
]]>urn:uuid:8b319d42-657d-4f40-a1ee-e01bde5950b9Cities with the fastest-growing home prices in the Kennewick metro area2026-03-24T17:02:35-04:002026-03-24T17:02:35-04:00StackerKennewickStacker compiled a list of cities with the fastest growing home prices in the Kennewick-Richland, WA metro using data from Zillow.]]>
Volodymyr Kyrylyuk // Shutterstock
Cities with the fastest-growing home prices in the Kennewick metro area
The real estate frenzy spurred by the coronavirus pandemic continues, though at a slower pace. Buyers are still competing for a limited supply of housing, driving up prices for affordable properties.
The typical home value in the United States was $361,371 in February, 0.4% higher than the year before.
Increasing mortgage rates have slowed growth, with prices even declining in some places. But some areas are still seeing price jumps compared to the year before.
Stacker compiled a list of cities with the most expensive homes in the Kennewick-Richland, WA metro area using data from Zillow. Charts show the monthly typical home value since January 2018.
Stacker
#9. Benton City, WA
- 1-year price change: -$4,754 (-1.1%) - 5-year price change: +$90,004 (+27.4%) - Typical home value: $418,242 (#6 most expensive city in metro)
Stacker
#8. Pasco, WA
- 1-year price change: -$2,781 (-0.7%) - 5-year price change: +$92,765 (+28.7%) - Typical home value: $415,613 (#7 most expensive city in metro)
Stacker
#7. West Richland, WA
- 1-year price change: -$1,154 (-0.2%) - 5-year price change: +$98,776 (+25.3%) - Typical home value: $488,659 (#3 most expensive city in metro)
Stacker
#6. Prosser, WA
- 1-year price change: -$581 (-0.1%) - 5-year price change: +$70,682 (+20.7%) - Typical home value: $411,325 (#8 most expensive city in metro)
Stacker
#5. Kennewick, WA
- 1-year price change: -$496 (-0.1%) - 5-year price change: +$90,204 (+27.0%) - Typical home value: $424,813 (#5 most expensive city in metro)
Stacker
#4. Mesa, WA
- 1-year price change: +$2,061 (+0.4%) - 5-year price change: +$123,172 (+27.5%) - Typical home value: $571,841 (#2 most expensive city in metro)
Stacker
#3. Richland, WA
- 1-year price change: +$2,077 (+0.5%) - 5-year price change: +$97,363 (+26.8%) - Typical home value: $460,977 (#4 most expensive city in metro)
Stacker
#2. Connell, WA
- 1-year price change: +$6,946 (+2.2%) - 5-year price change: +$84,523 (+35.2%) - Typical home value: $324,336 (#9 most expensive city in metro)
Stacker
#1. Eltopia, WA
- 1-year price change: +$35,604 (+5.2%) - 5-year price change: +$209,442 (+40.7%) - Typical home value: $723,457 (#1 most expensive city in metro)
]]>urn:uuid:6d163643-0df4-45ad-be5f-858e9ebaa167Cities with the fastest-growing home prices in the Bremerton metro area2026-03-24T17:01:39-04:002026-03-24T17:01:39-04:00StackerBremertonStacker compiled a list of cities with the fastest growing home prices in the Bremerton-Silverdale-Port Orchard, WA metro using data from Zillow.]]>
FOTOGRIN // Shutterstock
Cities with the fastest-growing home prices in the Bremerton metro area
The real estate frenzy spurred by the coronavirus pandemic continues, though at a slower pace. Buyers are still competing for a limited supply of housing, driving up prices for affordable properties.
The typical home value in the United States was $361,371 in February, 0.4% higher than the year before.
Increasing mortgage rates have slowed growth, with prices even declining in some places. But some areas are still seeing price jumps compared to the year before.
Stacker compiled a list of cities with the most expensive homes in the Bremerton-Silverdale-Port Orchard, WA metro area using data from Zillow. Charts show the monthly typical home value since January 2018.
Stacker
#12. Suquamish, WA
- 1-year price change: +$19 (+0.0%) - 5-year price change: +$86,417 (+22.7%) - Typical home value: $467,088 (#12 most expensive city in metro)
Stacker
#11. Hansville, WA
- 1-year price change: +$3,687 (+0.5%) - 5-year price change: +$143,032 (+25.9%) - Typical home value: $695,038 (#3 most expensive city in metro)
Stacker
#10. Keyport, WA
- 1-year price change: +$6,356 (+1.1%) - 5-year price change: +$98,504 (+21.2%) - Typical home value: $563,756 (#9 most expensive city in metro)
Stacker
#9. Poulsbo, WA
- 1-year price change: +$6,836 (+1.1%) - 5-year price change: +$119,688 (+22.3%) - Typical home value: $656,741 (#6 most expensive city in metro)
Stacker
#8. Bremerton, WA
- 1-year price change: +$7,059 (+1.5%) - 5-year price change: +$69,404 (+17.0%) - Typical home value: $477,013 (#11 most expensive city in metro)
Stacker
#7. Olalla, WA
- 1-year price change: +$9,065 (+1.3%) - 5-year price change: +$152,016 (+27.5%) - Typical home value: $704,089 (#2 most expensive city in metro)
Stacker
#6. Silverdale, WA
- 1-year price change: +$9,744 (+1.7%) - 5-year price change: +$102,030 (+20.6%) - Typical home value: $597,574 (#8 most expensive city in metro)
Stacker
#5. Kingston, WA
- 1-year price change: +$10,480 (+1.6%) - 5-year price change: +$122,176 (+23.0%) - Typical home value: $653,038 (#7 most expensive city in metro)
Stacker
#4. Port Orchard, WA
- 1-year price change: +$11,042 (+2.0%) - 5-year price change: +$98,527 (+21.8%) - Typical home value: $550,323 (#10 most expensive city in metro)
Stacker
#3. Bainbridge Island, WA
- 1-year price change: +$11,699 (+1.0%) - 5-year price change: +$229,129 (+25.0%) - Typical home value: $1,146,582 (#1 most expensive city in metro)
Stacker
#2. Indianola, WA
- 1-year price change: +$17,244 (+2.6%) - 5-year price change: +$113,527 (+20.4%) - Typical home value: $670,136 (#5 most expensive city in metro)
Stacker
#1. Seabeck, WA
- 1-year price change: +$21,802 (+3.3%) - 5-year price change: +$137,766 (+25.5%) - Typical home value: $677,214 (#4 most expensive city in metro)
]]>urn:uuid:60ae1183-ec36-4b83-841a-a0670523db91Cities with the fastest-growing home prices in the Bellingham metro area2026-03-24T17:01:35-04:002026-03-24T17:01:35-04:00StackerBellinghamStacker compiled a list of cities with the fastest growing home prices in the Bellingham, WA metro using data from Zillow.]]>
Volodymyr Kyrylyuk // Shutterstock
Cities with the fastest-growing home prices in the Bellingham metro area
The real estate frenzy spurred by the coronavirus pandemic continues, though at a slower pace. Buyers are still competing for a limited supply of housing, driving up prices for affordable properties.
The typical home value in the United States was $361,371 in February, 0.4% higher than the year before.
Increasing mortgage rates have slowed growth, with prices even declining in some places. But some areas are still seeing price jumps compared to the year before.
Stacker compiled a list of cities with the most expensive homes in the Bellingham, WA metro area using data from Zillow. Charts show the monthly typical home value since January 2018.
Stacker
#14. Lummi Island, WA
- 1-year price change: -$9,625 (-1.5%) - 5-year price change: +$142,587 (+29.5%) - Typical home value: $625,667 (#3 most expensive city in metro)
Stacker
#13. Custer, WA
- 1-year price change: -$3,513 (-0.5%) - 5-year price change: +$146,707 (+29.4%) - Typical home value: $645,640 (#2 most expensive city in metro)
Stacker
#12. Blaine, WA
- 1-year price change: -$1,499 (-0.3%) - 5-year price change: +$115,419 (+27.6%) - Typical home value: $534,076 (#6 most expensive city in metro)
Stacker
#11. Rockport, WA
- 1-year price change: -$73 (-0.0%) - 5-year price change: +$88,579 (+29.7%) - Typical home value: $386,325 (#12 most expensive city in metro)
Stacker
#10. Ferndale, WA
- 1-year price change: +$339 (+0.1%) - 5-year price change: +$139,307 (+29.7%) - Typical home value: $608,145 (#5 most expensive city in metro)
Stacker
#9. Everson, WA
- 1-year price change: +$905 (+0.2%) - 5-year price change: +$93,043 (+23.9%) - Typical home value: $481,565 (#9 most expensive city in metro)
Stacker
#8. Acme, WA
- 1-year price change: +$1,173 (+0.2%) - 5-year price change: +$67,975 (+16.5%) - Typical home value: $478,905 (#10 most expensive city in metro)
Stacker
#7. Bellingham, WA
- 1-year price change: +$1,433 (+0.2%) - 5-year price change: +$146,833 (+28.7%) - Typical home value: $658,167 (#1 most expensive city in metro)
Stacker
#6. Deming, WA
- 1-year price change: +$3,603 (+1.2%) - 5-year price change: +$77,874 (+33.1%) - Typical home value: $313,066 (#14 most expensive city in metro)
Stacker
#5. Maple Falls, WA
- 1-year price change: +$5,042 (+1.4%) - 5-year price change: +$96,142 (+36.9%) - Typical home value: $357,000 (#13 most expensive city in metro)
Stacker
#4. Nooksack, WA
- 1-year price change: +$5,266 (+1.0%) - 5-year price change: +$115,070 (+29.2%) - Typical home value: $509,442 (#7 most expensive city in metro)
Stacker
#3. Lynden, WA
- 1-year price change: +$11,847 (+2.0%) - 5-year price change: +$147,774 (+31.5%) - Typical home value: $616,773 (#4 most expensive city in metro)
Stacker
#2. Sumas, WA
- 1-year price change: +$15,267 (+3.2%) - 5-year price change: +$88,735 (+22.1%) - Typical home value: $490,954 (#8 most expensive city in metro)
Stacker
#1. Point Roberts, WA
- 1-year price change: +$17,646 (+4.8%) - 5-year price change: +$63,893 (+19.8%) - Typical home value: $386,970 (#11 most expensive city in metro)
]]>urn:uuid:99347647-f87f-4559-af9d-d6f04cfd411fAre home prices going down in Yakima in 2026?2026-03-23T15:13:48-04:002026-03-23T15:13:48-04:00StackerYakimaRedfin Real Estate compiled data on how home prices have changed in Yakima, WA in 2026.]]>
Billion Photos // Shutterstock
Are home prices going down in Yakima in 2026?
U.S. home prices have set monthly record highs for over two years straight, pricing out many homebuyers and keeping more home sellers on the sidelines. Prices skyrocketed during the pandemic and have remained elevated since, largely due to persistent inflation and a chronic inventory shortage.
But the market is starting to shift. Prices are growing more slowly as demand cools and more sellers offer discounts, helping affordability improve and setting the stage for a longer-term housing market "reset" back to normalcy.
So, what's happening with home prices in Yakima, WA? Are they dropping or rising? Redfin Real Estate took a look at local median sale prices over the past month, year, and six years to find out. All data represents the monthly average for February 2026.
]]>urn:uuid:fd3a41be-3def-4a8c-b08c-87371abd9a81Are home prices going down in Wenatchee in 2026?2026-03-23T15:13:46-04:002026-03-23T15:13:46-04:00StackerWenatcheeRedfin Real Estate compiled data on how home prices have changed in Wenatchee, WA in 2026.]]>
Andy Dean Photography // Shutterstock
Are home prices going down in Wenatchee in 2026?
U.S. home prices have set monthly record highs for over two years straight, pricing out many homebuyers and keeping more home sellers on the sidelines. Prices skyrocketed during the pandemic and have remained elevated since, largely due to persistent inflation and a chronic inventory shortage.
But the market is starting to shift. Prices are growing more slowly as demand cools and more sellers offer discounts, helping affordability improve and setting the stage for a longer-term housing market "reset" back to normalcy.
So, what's happening with home prices in Wenatchee, WA? Are they dropping or rising? Redfin Real Estate took a look at local median sale prices over the past month, year, and six years to find out. All data represents the monthly average for February 2026.
]]>urn:uuid:42bd6371-bd15-4eb2-bb1f-ae7ef1658c34Are home prices going down in Walla Walla in 2026?2026-03-23T15:13:45-04:002026-03-23T15:13:45-04:00StackerWalla WallaRedfin Real Estate compiled data on how home prices have changed in Walla Walla, WA in 2026.]]>
Aleksandrkozak // Shutterstock
Are home prices going down in Walla Walla in 2026?
U.S. home prices have set monthly record highs for over two years straight, pricing out many homebuyers and keeping more home sellers on the sidelines. Prices skyrocketed during the pandemic and have remained elevated since, largely due to persistent inflation and a chronic inventory shortage.
But the market is starting to shift. Prices are growing more slowly as demand cools and more sellers offer discounts, helping affordability improve and setting the stage for a longer-term housing market "reset" back to normalcy.
So, what's happening with home prices in Walla Walla, WA? Are they dropping or rising? Redfin Real Estate took a look at local median sale prices over the past month, year, and six years to find out. All data represents the monthly average for February 2026.
]]>urn:uuid:ce6319a7-0fd3-4c45-9fed-e64335172cb8Are home prices going down in Spokane in 2026?2026-03-23T15:13:40-04:002026-03-23T15:13:40-04:00StackerSpokaneRedfin Real Estate compiled data on how home prices have changed in Spokane, WA in 2026.]]>
Billion Photos // Shutterstock
Are home prices going down in Spokane in 2026?
U.S. home prices have set monthly record highs for over two years straight, pricing out many homebuyers and keeping more home sellers on the sidelines. Prices skyrocketed during the pandemic and have remained elevated since, largely due to persistent inflation and a chronic inventory shortage.
But the market is starting to shift. Prices are growing more slowly as demand cools and more sellers offer discounts, helping affordability improve and setting the stage for a longer-term housing market "reset" back to normalcy.
So, what's happening with home prices in Spokane, WA? Are they dropping or rising? Redfin Real Estate took a look at local median sale prices over the past month, year, and six years to find out. All data represents the monthly average for February 2026.
]]>urn:uuid:5e721e2c-8c14-470e-81f1-676da4df8adcAre home prices going down in Seattle in 2026?2026-03-23T15:13:38-04:002026-03-23T15:13:38-04:00StackerSeattleRedfin Real Estate compiled data on how home prices have changed in Seattle, WA in 2026.]]>
Aleksandrkozak // Shutterstock
Are home prices going down in Seattle in 2026?
U.S. home prices have set monthly record highs for over two years straight, pricing out many homebuyers and keeping more home sellers on the sidelines. Prices skyrocketed during the pandemic and have remained elevated since, largely due to persistent inflation and a chronic inventory shortage.
But the market is starting to shift. Prices are growing more slowly as demand cools and more sellers offer discounts, helping affordability improve and setting the stage for a longer-term housing market "reset" back to normalcy.
So, what's happening with home prices in Seattle, WA? Are they dropping or rising? Redfin Real Estate took a look at local median sale prices over the past month, year, and six years to find out. All data represents the monthly average for February 2026.
]]>urn:uuid:cec48359-1e3f-4da0-9c02-afb75f9065f9Are home prices going down in Olympia in 2026?2026-03-23T15:13:30-04:002026-03-23T15:13:30-04:00StackerOlympiaRedfin Real Estate compiled data on how home prices have changed in Olympia, WA in 2026.]]>
Andy Dean Photography // Shutterstock
Are home prices going down in Olympia in 2026?
U.S. home prices have set monthly record highs for over two years straight, pricing out many homebuyers and keeping more home sellers on the sidelines. Prices skyrocketed during the pandemic and have remained elevated since, largely due to persistent inflation and a chronic inventory shortage.
But the market is starting to shift. Prices are growing more slowly as demand cools and more sellers offer discounts, helping affordability improve and setting the stage for a longer-term housing market "reset" back to normalcy.
So, what's happening with home prices in Olympia, WA? Are they dropping or rising? Redfin Real Estate took a look at local median sale prices over the past month, year, and six years to find out. All data represents the monthly average for February 2026.
]]>urn:uuid:706220fb-097f-489b-8f02-7d1a2c398681Are home prices going down in Mount Vernon in 2026?2026-03-23T15:13:28-04:002026-03-23T15:13:28-04:00StackerMount VernonRedfin Real Estate compiled data on how home prices have changed in Mount Vernon, WA in 2026.]]>
Andy Dean Photography // Shutterstock
Are home prices going down in Mount Vernon in 2026?
U.S. home prices have set monthly record highs for over two years straight, pricing out many homebuyers and keeping more home sellers on the sidelines. Prices skyrocketed during the pandemic and have remained elevated since, largely due to persistent inflation and a chronic inventory shortage.
But the market is starting to shift. Prices are growing more slowly as demand cools and more sellers offer discounts, helping affordability improve and setting the stage for a longer-term housing market "reset" back to normalcy.
So, what's happening with home prices in Mount Vernon, WA? Are they dropping or rising? Redfin Real Estate took a look at local median sale prices over the past month, year, and six years to find out. All data represents the monthly average for February 2026.
]]>urn:uuid:0ba78de1-31c6-428d-bb6d-8adcf5aac4d4Are home prices going down in Longview in 2026?2026-03-23T15:13:25-04:002026-03-23T15:13:25-04:00StackerLongviewRedfin Real Estate compiled data on how home prices have changed in Longview, WA in 2026.]]>
Aleksandrkozak // Shutterstock
Are home prices going down in Longview in 2026?
U.S. home prices have set monthly record highs for over two years straight, pricing out many homebuyers and keeping more home sellers on the sidelines. Prices skyrocketed during the pandemic and have remained elevated since, largely due to persistent inflation and a chronic inventory shortage.
But the market is starting to shift. Prices are growing more slowly as demand cools and more sellers offer discounts, helping affordability improve and setting the stage for a longer-term housing market "reset" back to normalcy.
So, what's happening with home prices in Longview, WA? Are they dropping or rising? Redfin Real Estate took a look at local median sale prices over the past month, year, and six years to find out. All data represents the monthly average for February 2026.
]]>urn:uuid:623a7c06-d3b6-441e-ab81-8e91b772b4eeAre home prices going down in Kennewick in 2026?2026-03-23T15:12:52-04:002026-03-23T15:12:52-04:00StackerKennewickRedfin Real Estate compiled data on how home prices have changed in Kennewick, WA in 2026.]]>
Andy Dean Photography // Shutterstock
Are home prices going down in Kennewick in 2026?
U.S. home prices have set monthly record highs for over two years straight, pricing out many homebuyers and keeping more home sellers on the sidelines. Prices skyrocketed during the pandemic and have remained elevated since, largely due to persistent inflation and a chronic inventory shortage.
But the market is starting to shift. Prices are growing more slowly as demand cools and more sellers offer discounts, helping affordability improve and setting the stage for a longer-term housing market "reset" back to normalcy.
So, what's happening with home prices in Kennewick, WA? Are they dropping or rising? Redfin Real Estate took a look at local median sale prices over the past month, year, and six years to find out. All data represents the monthly average for February 2026.
]]>urn:uuid:bebb14d3-b8ac-454b-81af-31b2b23c1b43Are home prices going down in Bremerton in 2026?2026-03-23T15:12:31-04:002026-03-23T15:12:31-04:00StackerBremertonRedfin Real Estate compiled data on how home prices have changed in Bremerton, WA in 2026.]]>
Billion Photos // Shutterstock
Are home prices going down in Bremerton in 2026?
U.S. home prices have set monthly record highs for over two years straight, pricing out many homebuyers and keeping more home sellers on the sidelines. Prices skyrocketed during the pandemic and have remained elevated since, largely due to persistent inflation and a chronic inventory shortage.
But the market is starting to shift. Prices are growing more slowly as demand cools and more sellers offer discounts, helping affordability improve and setting the stage for a longer-term housing market "reset" back to normalcy.
So, what's happening with home prices in Bremerton, WA? Are they dropping or rising? Redfin Real Estate took a look at local median sale prices over the past month, year, and six years to find out. All data represents the monthly average for February 2026.
]]>urn:uuid:d73a78fd-ca0d-4d97-b954-dc49af41bd9dAre home prices going down in Bellingham in 2026?2026-03-23T15:12:30-04:002026-03-23T15:12:30-04:00StackerBellinghamRedfin Real Estate compiled data on how home prices have changed in Bellingham, WA in 2026.]]>
Andy Dean Photography // Shutterstock
Are home prices going down in Bellingham in 2026?
U.S. home prices have set monthly record highs for over two years straight, pricing out many homebuyers and keeping more home sellers on the sidelines. Prices skyrocketed during the pandemic and have remained elevated since, largely due to persistent inflation and a chronic inventory shortage.
But the market is starting to shift. Prices are growing more slowly as demand cools and more sellers offer discounts, helping affordability improve and setting the stage for a longer-term housing market "reset" back to normalcy.
So, what's happening with home prices in Bellingham, WA? Are they dropping or rising? Redfin Real Estate took a look at local median sale prices over the past month, year, and six years to find out. All data represents the monthly average for February 2026.
]]>urn:uuid:3f179170-d9b5-4773-80d8-e6d0b510dbedMost popular girl names in the 80s in Washington2026-03-23T14:21:15-04:002026-03-23T14:21:15-04:00StackerWashingtonStacker compiled the most popular baby names for girls of the 1980s in Washington using data from the Social Security Administration.]]>
Natalia Kirichenko // Shutterstock
Most popular girl names in the 80s in Washington
Whether it's a long-held family name, a biblical name, or a name that holds special meaning for mom or dad, choosing the moniker that your child will carry for life isn't something to take lightly. Over the years, certain names have peaked and then faded in popularity while others stayed at the top of the rankings for multiple decades. And while traditional and biblical names always seem to be in style, we've also seen some more uncommon names become trendy.
Stacker compiled a list of the most popular baby names for girls in the 80s in Washington using data from the Social Security Administration. Names are ranked by number of babies born.
Many baby names are inspired by pop culture of the time, whether movies, music, or television. Others represent familial names or have other traditional significance. Keep reading to see if your name made the list.
Tatiana Katsai // Shutterstock
#30. Brittany
Brittany is a name of French origin meaning "from Briton".
Washington - Babies from 1980 to 1989: 2,060 - Babies from 2015 to 2024: 33 (#1161 most common name, -98.4% compared to the 80s)
National: - Babies from 1980 to 1989: 140,812 (#21 most common name)
Tatyana Domnicheva // Shutterstock
#29. Samantha
Samantha is a name of Hebrew origin meaning "told by God".
Washington - Babies from 1980 to 1989: 2,086 - Babies from 2015 to 2024: 766 (#74 most common name, -63.3% compared to the 80s)
National: - Babies from 1980 to 1989: 121,126 (#26 most common name)
Monkey Business Images // Shutterstock
#28. Jamie
Jamie is a name of Scottish origin meaning "supplanter".
Washington - Babies from 1980 to 1989: 2,156 - Babies from 2015 to 2024: 106 (#624 most common name, -95.1% compared to the 80s)
National: - Babies from 1980 to 1989: 96,557 (#34 most common name)
javi_indy // Shutterstock
#27. Andrea
Andrea is a name of Greek origin meaning "brave".
Washington - Babies from 1980 to 1989: 2,218 - Babies from 2015 to 2024: 400 (#175 most common name, -82.0% compared to the 80s)
National: - Babies from 1980 to 1989: 98,264 (#33 most common name)
Krystyna Taran // Shutterstock
#26. Kimberly
Kimberly is a name of English origin meaning "from the wood of the royal forest".
Washington - Babies from 1980 to 1989: 2,298 - Babies from 2015 to 2024: 330 (#215 (tie) most common name, -85.6% compared to the 80s)
National: - Babies from 1980 to 1989: 146,453 (#17 most common name)
Studio Romantic // Shutterstock
#25. Laura
Laura is a name of Latin origin meaning "bay laurel plant".
Washington - Babies from 1980 to 1989: 2,322 - Babies from 2015 to 2024: 206 (#350 most common name, -91.1% compared to the 80s)
National: - Babies from 1980 to 1989: 134,611 (#23 most common name)
pixelheadphoto digitalskillet // Shutterstock
#24. Crystal
Crystal is a name of Latin origin meaning "Earth mineral".
Washington - Babies from 1980 to 1989: 2,373 - Babies from 2015 to 2024: 80 (#751 (tie) most common name, -96.6% compared to the 80s)
National: - Babies from 1980 to 1989: 141,009 (#20 most common name)
CroMary // Shutterstock
#23. Tiffany
Tiffany is a name of Greek origin meaning "appearance of God".
Washington - Babies from 1980 to 1989: 2,392 - Babies from 2015 to 2024: 68 (#834 most common name, -97.2% compared to the 80s)
National: - Babies from 1980 to 1989: 158,625 (#11 most common name)
Africa Studio // Shutterstock
#22. Sara
Sara is a derivation of the name Sarah, of Hebrew origin meaning "princess".
Washington - Babies from 1980 to 1989: 2,407 - Babies from 2015 to 2024: 302 (#241 (tie) most common name, -87.5% compared to the 80s)
National: - Babies from 1980 to 1989: 104,681 (#30 most common name)
Michael Pettigrew // Shutterstock
#21. Angela
Angela is a name of Latin origin meaning "messenger of God".
Washington - Babies from 1980 to 1989: 2,421 - Babies from 2015 to 2024: 273 (#262 most common name, -88.7% compared to the 80s)
National: - Babies from 1980 to 1989: 116,594 (#27 most common name)
New Africa // Shutterstock
#20. Erin
Erin is a name of Irish origin meaning "peace".
Washington - Babies from 1980 to 1989: 2,506 - Babies from 2015 to 2024: 96 (#668 (tie) most common name, -96.2% compared to the 80s)
National: - Babies from 1980 to 1989: 115,811 (#28 most common name)
DONOT6_STUDIO // Shutterstock
#19. Danielle
Danielle is a name of Hebrew origin meaning "God is my judge".
Washington - Babies from 1980 to 1989: 2,521 - Babies from 2015 to 2024: 156 (#442 (tie) most common name, -93.8% compared to the 80s)
National: - Babies from 1980 to 1989: 134,380 (#24 most common name)
Tetiana Iatsenko // Shutterstock
#18. Christina
Christina is a name of Latin origin meaning "follower of Christ".
Washington - Babies from 1980 to 1989: 2,604 - Babies from 2015 to 2024: 106 (#624 most common name, -95.9% compared to the 80s)
National: - Babies from 1980 to 1989: 146,011 (#18 most common name)
Aaron Amat // Shutterstock
#17. Rebecca
Rebecca is a name of Hebrew origin meaning "servant of God".
Washington - Babies from 1980 to 1989: 2,613 - Babies from 2015 to 2024: 257 (#282 most common name, -90.2% compared to the 80s)
National: - Babies from 1980 to 1989: 136,243 (#22 most common name)
Monkey Business Images // Shutterstock
#16. Emily
Emily is a name of Latin origin meaning "to strive".
Washington - Babies from 1980 to 1989: 2,772 - Babies from 2015 to 2024: 1,997 (#12 most common name, -28.0% compared to the 80s)
National: - Babies from 1980 to 1989: 131,770 (#25 most common name)
phadungsak sawasdee // Shutterstock
#15. Amy
Amy is a name of French origin meaning "beloved".
Washington - Babies from 1980 to 1989: 3,020 - Babies from 2015 to 2024: 304 (#238 most common name, -89.9% compared to the 80s)
National: - Babies from 1980 to 1989: 150,659 (#15 most common name)
Liudmila Fadzeyeva // Shutterstock
#14. Amber
Amber is a name of Persian origin meaning "ambergris", a fragrant material extracted from a type of whale.
Washington - Babies from 1980 to 1989: 3,128 - Babies from 2015 to 2024: 156 (#442 (tie) most common name, -95.0% compared to the 80s)
National: - Babies from 1980 to 1989: 153,951 (#13 most common name)
Black-Photogaphy // Shutterstock
#13. Michelle
Michelle is a name of Hebrew origin meaning "who is like God?".
Washington - Babies from 1980 to 1989: 3,234 - Babies from 2015 to 2024: 231 (#312 (tie) most common name, -92.9% compared to the 80s)
National: - Babies from 1980 to 1989: 154,032 (#12 most common name)
Monkey Business Images // Shutterstock
#12. Megan
Megan is a name of Welsh origin meaning "pearl".
Washington - Babies from 1980 to 1989: 3,417 - Babies from 2015 to 2024: 107 (#615 (tie) most common name, -96.9% compared to the 80s)
National: - Babies from 1980 to 1989: 153,502 (#14 most common name)
DONUT6_STUDIO // Shutterstock
#11. Rachel
Rachel is a name of Hebrew origin meaning "ewe".
Washington - Babies from 1980 to 1989: 3,552 - Babies from 2015 to 2024: 287 (#256 (tie) most common name, -91.9% compared to the 80s)
National: - Babies from 1980 to 1989: 146,678 (#16 most common name)
Lopolo // Shutterstock
#10. Elizabeth
Elizabeth is a name of Hebrew origin meaning "god is my oath".
Washington - Babies from 1980 to 1989: 3,558 - Babies from 2015 to 2024: 1,950 (#13 most common name, -45.2% compared to the 80s)
National: - Babies from 1980 to 1989: 198,977 (#9 most common name)
Maria Evseyeva // Shutterstock
#9. Heather
Heather is a name of Scottish origin meaning "a variety of small shrubs with pink or white flowers".
Washington - Babies from 1980 to 1989: 3,670 - Babies from 2015 to 2024: 66 (#848 most common name, -98.2% compared to the 80s)
National: - Babies from 1980 to 1989: 191,854 (#10 most common name)
Natee K Jindakum // Shutterstock
#8. Melissa
Melissa is a name of Greek origin meaning "honey bee".
Washington - Babies from 1980 to 1989: 3,954 - Babies from 2015 to 2024: 233 (#310 (tie) most common name, -94.1% compared to the 80s)
National: - Babies from 1980 to 1989: 217,929 (#7 most common name)
Monkey Business Images // Shutterstock
#7. Stephanie
Stephanie is a name of Greek origin meaning "crown".
Washington - Babies from 1980 to 1989: 4,057 - Babies from 2015 to 2024: 166 (#421 most common name, -95.9% compared to the 80s)
National: - Babies from 1980 to 1989: 218,175 (#6 most common name)
Impact Photography // Shutterstock
#6. Nicole
Nicole is a name of Greek origin meaning "victory of the people".
Washington - Babies from 1980 to 1989: 4,231 - Babies from 2015 to 2024: 293 (#251 most common name, -93.1% compared to the 80s)
National: - Babies from 1980 to 1989: 210,498 (#8 most common name)
Monkey Business Images // Shutterstock
#5. Ashley
Ashley is a name of English origin meaning "ash tree meadow".
Washington - Babies from 1980 to 1989: 5,388 - Babies from 2015 to 2024: 372 (#188 (tie) most common name, -93.1% compared to the 80s)
National: - Babies from 1980 to 1989: 352,185 (#4 most common name)
Shyamalamuralinath // Shutterstock
#4. Sarah
Sarah is a name of Hebrew origin meaning "princess".
Washington - Babies from 1980 to 1989: 6,383 - Babies from 2015 to 2024: 610 (#98 most common name, -90.4% compared to the 80s)
National: - Babies from 1980 to 1989: 272,647 (#5 most common name)
Haywiremedia // Shutterstock
#3. Amanda
Amanda is a name of Latin origin meaning "worthy of love".
Washington - Babies from 1980 to 1989: 6,530 - Babies from 2015 to 2024: 138 (#503 most common name, -97.9% compared to the 80s)
National: - Babies from 1980 to 1989: 369,728 (#3 most common name)
Mcimage // Shutterstock
#2. Jennifer
Jennifer is a name of English origin meaning "white shadow, white wave".
Washington - Babies from 1980 to 1989: 7,963 - Babies from 2015 to 2024: 207 (#348 most common name, -97.4% compared to the 80s)
National: - Babies from 1980 to 1989: 440,916 (#2 most common name)
Kateryna Gurska // Shutterstock
#1. Jessica
Jessica is a name of Hebrew origin meaning "God beholds".
Washington - Babies from 1980 to 1989: 8,164 - Babies from 2015 to 2024: 248 (#295 most common name, -97.0% compared to the 80s)
National: - Babies from 1980 to 1989: 469,518 (#1 most common name)
]]>urn:uuid:b3ec0dba-2d98-450d-98a7-346d58fda9cfHow many homes are for sale in Yakima right now?2026-03-20T11:34:12-04:002026-03-20T11:34:12-04:00StackerYakimaRedfin Real Estate compiled data on how many homes are for sale in Yakima, WA.]]>
Billion Photos // Shutterstock
How many homes are for sale in Yakima right now?
One of the primary reasons houses are so expensive today is that there aren't enough homes for sale for people who want them. Ever since the pandemic housing boom—when record-low mortgage rates prompted homebuyers to snap up a large share of housing supply—listings have been much harder to come by. It's even harder to find a home that a typical buyer can afford.
However, housing supply varies widely across the country. In many Sun Belt cities, supply now exceeds demand after a wave of post-pandemic homebuilding and decline in activity. But in parts of the Midwest and Northeast, listings are few and far between due to strong competition for a dwindling number of homes.
So, how easy is it to find a house in Yakima? How many homes are for sale in the metro area right now? Redfin Real Estate took a look at active listings, new listings, inventory, and months of supply to better understand current housing availability. All data represents the monthly average for February 2026. Learn more about these housing metrics here.
]]>urn:uuid:3b957951-5996-4529-936d-d2f1b404bdccHow many homes are for sale in Wenatchee right now?2026-03-20T11:34:11-04:002026-03-20T11:34:11-04:00StackerWenatcheeRedfin Real Estate compiled data on how many homes are for sale in Wenatchee, WA.]]>
Andy Dean Photography // Shutterstock
How many homes are for sale in Wenatchee right now?
One of the primary reasons houses are so expensive today is that there aren't enough homes for sale for people who want them. Ever since the pandemic housing boom—when record-low mortgage rates prompted homebuyers to snap up a large share of housing supply—listings have been much harder to come by. It's even harder to find a home that a typical buyer can afford.
However, housing supply varies widely across the country. In many Sun Belt cities, supply now exceeds demand after a wave of post-pandemic homebuilding and decline in activity. But in parts of the Midwest and Northeast, listings are few and far between due to strong competition for a dwindling number of homes.
So, how easy is it to find a house in Wenatchee? How many homes are for sale in the metro area right now? Redfin Real Estate took a look at active listings, new listings, inventory, and months of supply to better understand current housing availability. All data represents the monthly average for February 2026. Learn more about these housing metrics here.
]]>urn:uuid:6294a62b-a217-4076-8de2-805db39a1c31How many homes are for sale in Walla Walla right now?2026-03-20T11:34:10-04:002026-03-20T11:34:10-04:00StackerWalla WallaRedfin Real Estate compiled data on how many homes are for sale in Walla Walla, WA.]]>
Andy Dean Photography // Shutterstock
How many homes are for sale in Walla Walla right now?
One of the primary reasons houses are so expensive today is that there aren't enough homes for sale for people who want them. Ever since the pandemic housing boom—when record-low mortgage rates prompted homebuyers to snap up a large share of housing supply—listings have been much harder to come by. It's even harder to find a home that a typical buyer can afford.
However, housing supply varies widely across the country. In many Sun Belt cities, supply now exceeds demand after a wave of post-pandemic homebuilding and decline in activity. But in parts of the Midwest and Northeast, listings are few and far between due to strong competition for a dwindling number of homes.
So, how easy is it to find a house in Walla Walla? How many homes are for sale in the metro area right now? Redfin Real Estate took a look at active listings, new listings, inventory, and months of supply to better understand current housing availability. All data represents the monthly average for February 2026. Learn more about these housing metrics here.
]]>urn:uuid:8f9edf4c-3437-4853-b2fd-da4829b8fe2aHow many homes are for sale in Spokane right now?2026-03-20T11:34:05-04:002026-03-20T11:34:05-04:00StackerSpokaneRedfin Real Estate compiled data on how many homes are for sale in Spokane, WA.]]>
Andy Dean Photography // Shutterstock
How many homes are for sale in Spokane right now?
One of the primary reasons houses are so expensive today is that there aren't enough homes for sale for people who want them. Ever since the pandemic housing boom—when record-low mortgage rates prompted homebuyers to snap up a large share of housing supply—listings have been much harder to come by. It's even harder to find a home that a typical buyer can afford.
However, housing supply varies widely across the country. In many Sun Belt cities, supply now exceeds demand after a wave of post-pandemic homebuilding and decline in activity. But in parts of the Midwest and Northeast, listings are few and far between due to strong competition for a dwindling number of homes.
So, how easy is it to find a house in Spokane? How many homes are for sale in the metro area right now? Redfin Real Estate took a look at active listings, new listings, inventory, and months of supply to better understand current housing availability. All data represents the monthly average for February 2026. Learn more about these housing metrics here.
]]>urn:uuid:2757dd18-a831-4ec4-916e-aebcf5e6f0adHow many homes are for sale in Seattle right now?2026-03-20T11:34:03-04:002026-03-20T11:34:03-04:00StackerSeattleRedfin Real Estate compiled data on how many homes are for sale in Seattle, WA.]]>
Andy Dean Photography // Shutterstock
How many homes are for sale in Seattle right now?
One of the primary reasons houses are so expensive today is that there aren't enough homes for sale for people who want them. Ever since the pandemic housing boom—when record-low mortgage rates prompted homebuyers to snap up a large share of housing supply—listings have been much harder to come by. It's even harder to find a home that a typical buyer can afford.
However, housing supply varies widely across the country. In many Sun Belt cities, supply now exceeds demand after a wave of post-pandemic homebuilding and decline in activity. But in parts of the Midwest and Northeast, listings are few and far between due to strong competition for a dwindling number of homes.
So, how easy is it to find a house in Seattle? How many homes are for sale in the metro area right now? Redfin Real Estate took a look at active listings, new listings, inventory, and months of supply to better understand current housing availability. All data represents the monthly average for February 2026. Learn more about these housing metrics here.
]]>urn:uuid:c850e6e5-dabe-41eb-8d5d-9fb07c5b47c7How many homes are for sale in Olympia right now?2026-03-20T11:33:55-04:002026-03-20T11:33:55-04:00StackerOlympiaRedfin Real Estate compiled data on how many homes are for sale in Olympia, WA.]]>
Andy Dean Photography // Shutterstock
How many homes are for sale in Olympia right now?
One of the primary reasons houses are so expensive today is that there aren't enough homes for sale for people who want them. Ever since the pandemic housing boom—when record-low mortgage rates prompted homebuyers to snap up a large share of housing supply—listings have been much harder to come by. It's even harder to find a home that a typical buyer can afford.
However, housing supply varies widely across the country. In many Sun Belt cities, supply now exceeds demand after a wave of post-pandemic homebuilding and decline in activity. But in parts of the Midwest and Northeast, listings are few and far between due to strong competition for a dwindling number of homes.
So, how easy is it to find a house in Olympia? How many homes are for sale in the metro area right now? Redfin Real Estate took a look at active listings, new listings, inventory, and months of supply to better understand current housing availability. All data represents the monthly average for February 2026. Learn more about these housing metrics here.
]]>urn:uuid:987da111-f61e-4c83-a8ad-9c944c40346eHow many homes are for sale in Mount Vernon right now?2026-03-20T11:33:53-04:002026-03-20T11:33:53-04:00StackerMount VernonRedfin Real Estate compiled data on how many homes are for sale in Mount Vernon, WA.]]>
Aleksandrkozak // Shutterstock
How many homes are for sale in Mount Vernon right now?
One of the primary reasons houses are so expensive today is that there aren't enough homes for sale for people who want them. Ever since the pandemic housing boom—when record-low mortgage rates prompted homebuyers to snap up a large share of housing supply—listings have been much harder to come by. It's even harder to find a home that a typical buyer can afford.
However, housing supply varies widely across the country. In many Sun Belt cities, supply now exceeds demand after a wave of post-pandemic homebuilding and decline in activity. But in parts of the Midwest and Northeast, listings are few and far between due to strong competition for a dwindling number of homes.
So, how easy is it to find a house in Mount Vernon? How many homes are for sale in the metro area right now? Redfin Real Estate took a look at active listings, new listings, inventory, and months of supply to better understand current housing availability. All data represents the monthly average for February 2026. Learn more about these housing metrics here.
]]>urn:uuid:24b50ac8-0996-47f2-a46c-2ee813b80ab0How many homes are for sale in Longview right now?2026-03-20T11:33:27-04:002026-03-20T11:33:27-04:00StackerLongviewRedfin Real Estate compiled data on how many homes are for sale in Longview, WA.]]>
Billion Photos // Shutterstock
How many homes are for sale in Longview right now?
One of the primary reasons houses are so expensive today is that there aren't enough homes for sale for people who want them. Ever since the pandemic housing boom—when record-low mortgage rates prompted homebuyers to snap up a large share of housing supply—listings have been much harder to come by. It's even harder to find a home that a typical buyer can afford.
However, housing supply varies widely across the country. In many Sun Belt cities, supply now exceeds demand after a wave of post-pandemic homebuilding and decline in activity. But in parts of the Midwest and Northeast, listings are few and far between due to strong competition for a dwindling number of homes.
So, how easy is it to find a house in Longview? How many homes are for sale in the metro area right now? Redfin Real Estate took a look at active listings, new listings, inventory, and months of supply to better understand current housing availability. All data represents the monthly average for February 2026. Learn more about these housing metrics here.
]]>urn:uuid:8337114a-5b89-439b-9a6e-cb7613d1f2baHow many homes are for sale in Kennewick right now?2026-03-20T11:33:22-04:002026-03-20T11:33:22-04:00StackerKennewickRedfin Real Estate compiled data on how many homes are for sale in Kennewick, WA.]]>
Andy Dean Photography // Shutterstock
How many homes are for sale in Kennewick right now?
One of the primary reasons houses are so expensive today is that there aren't enough homes for sale for people who want them. Ever since the pandemic housing boom—when record-low mortgage rates prompted homebuyers to snap up a large share of housing supply—listings have been much harder to come by. It's even harder to find a home that a typical buyer can afford.
However, housing supply varies widely across the country. In many Sun Belt cities, supply now exceeds demand after a wave of post-pandemic homebuilding and decline in activity. But in parts of the Midwest and Northeast, listings are few and far between due to strong competition for a dwindling number of homes.
So, how easy is it to find a house in Kennewick? How many homes are for sale in the metro area right now? Redfin Real Estate took a look at active listings, new listings, inventory, and months of supply to better understand current housing availability. All data represents the monthly average for February 2026. Learn more about these housing metrics here.


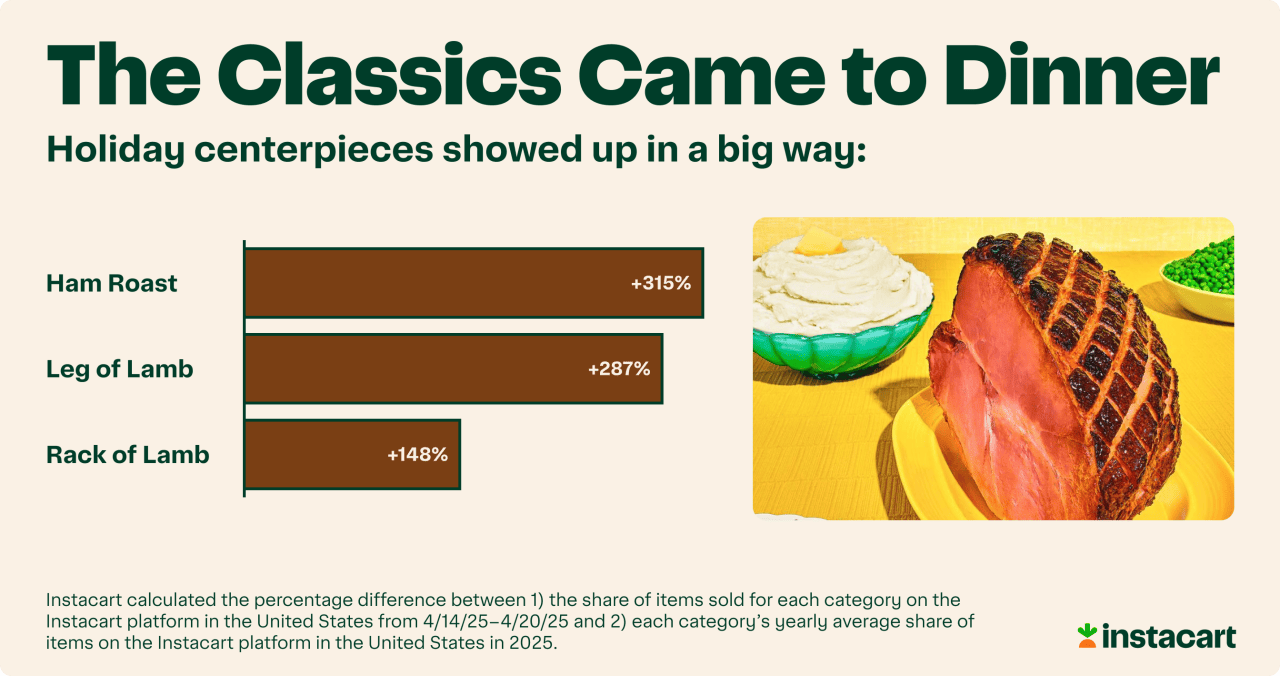
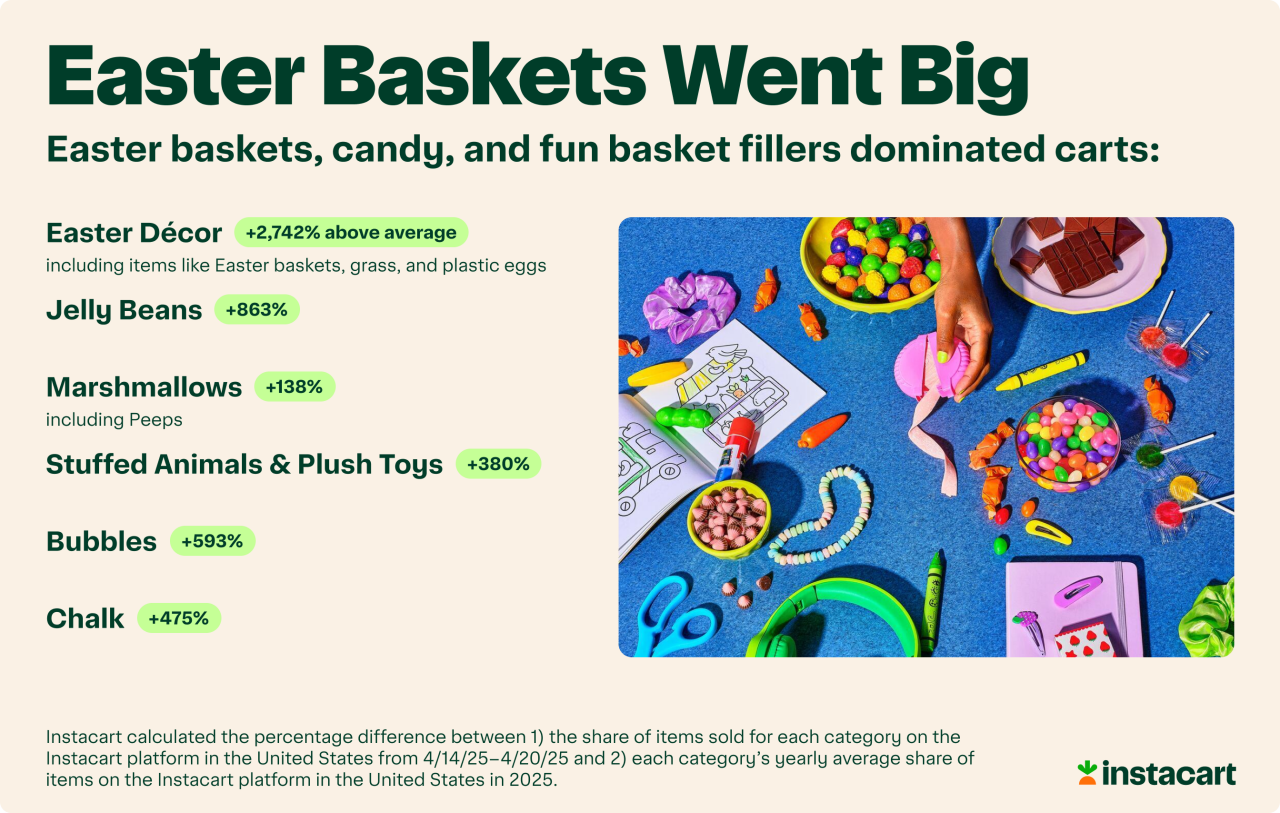

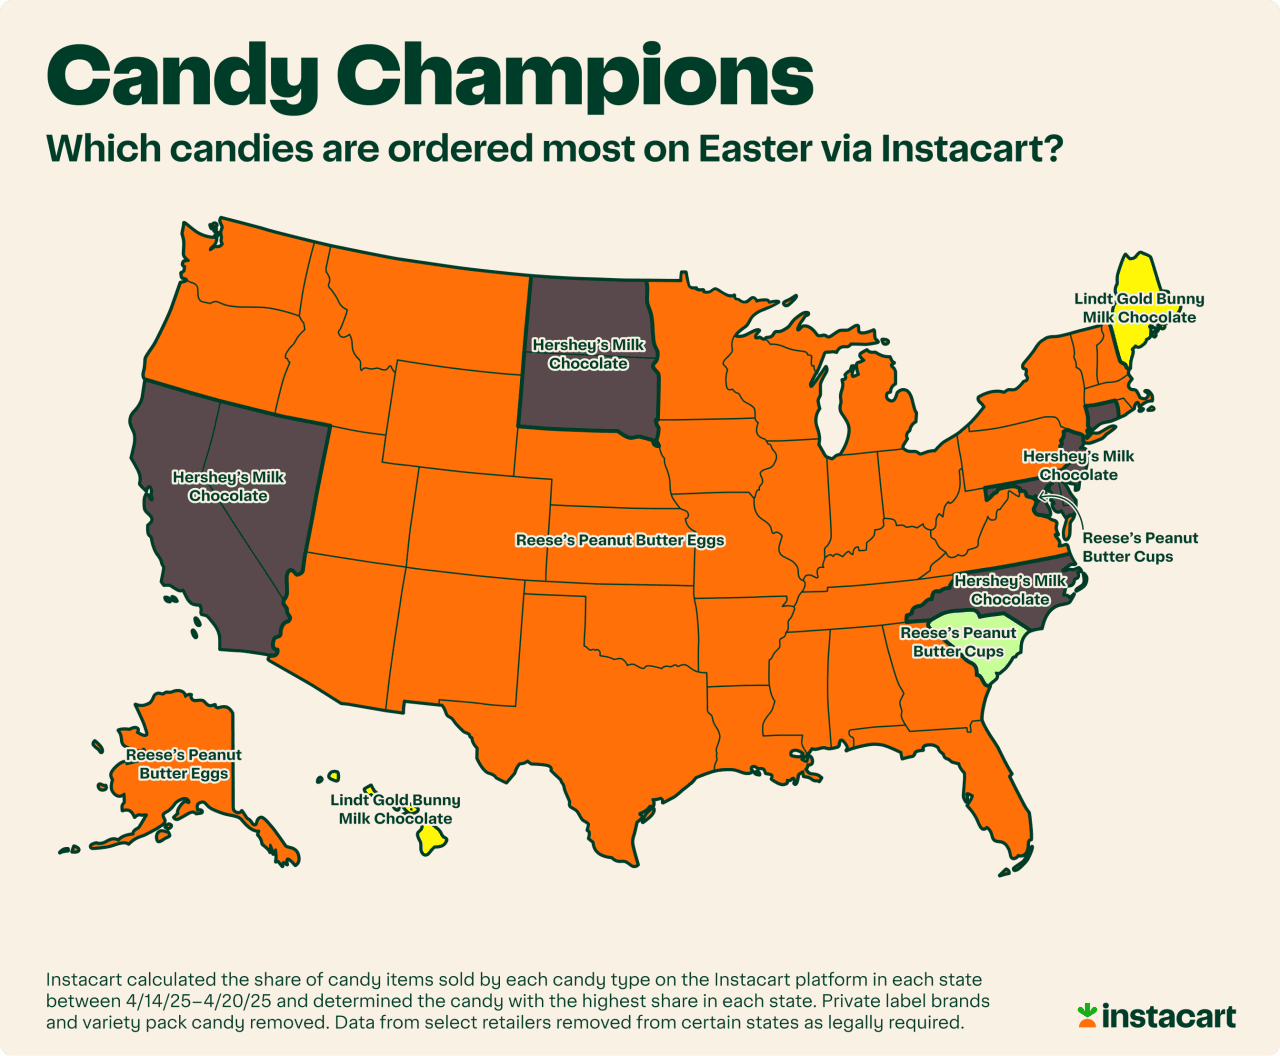
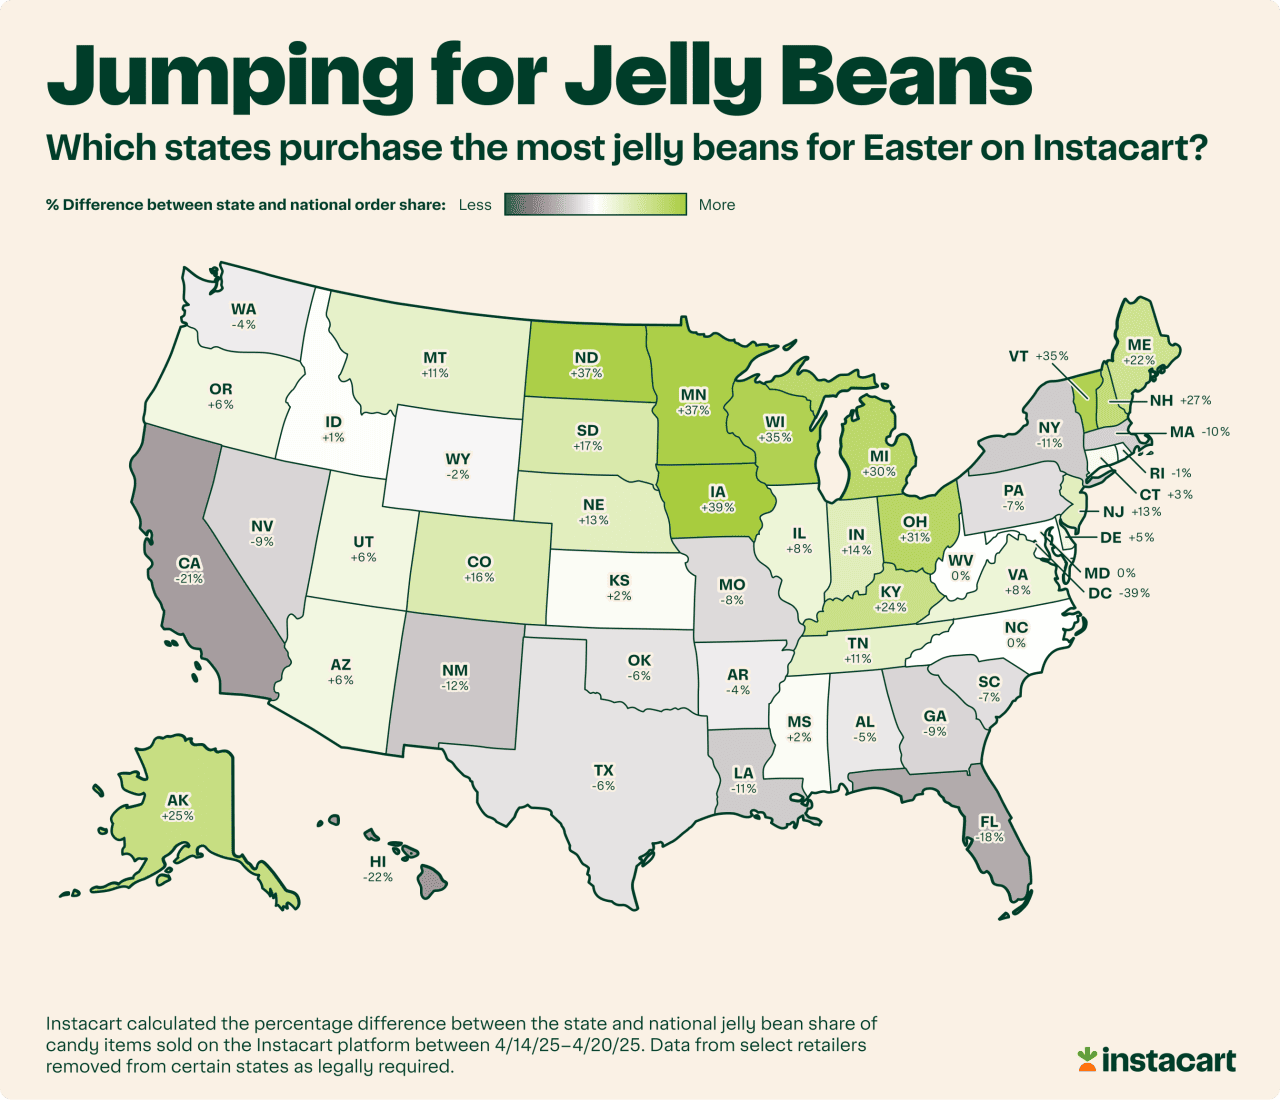
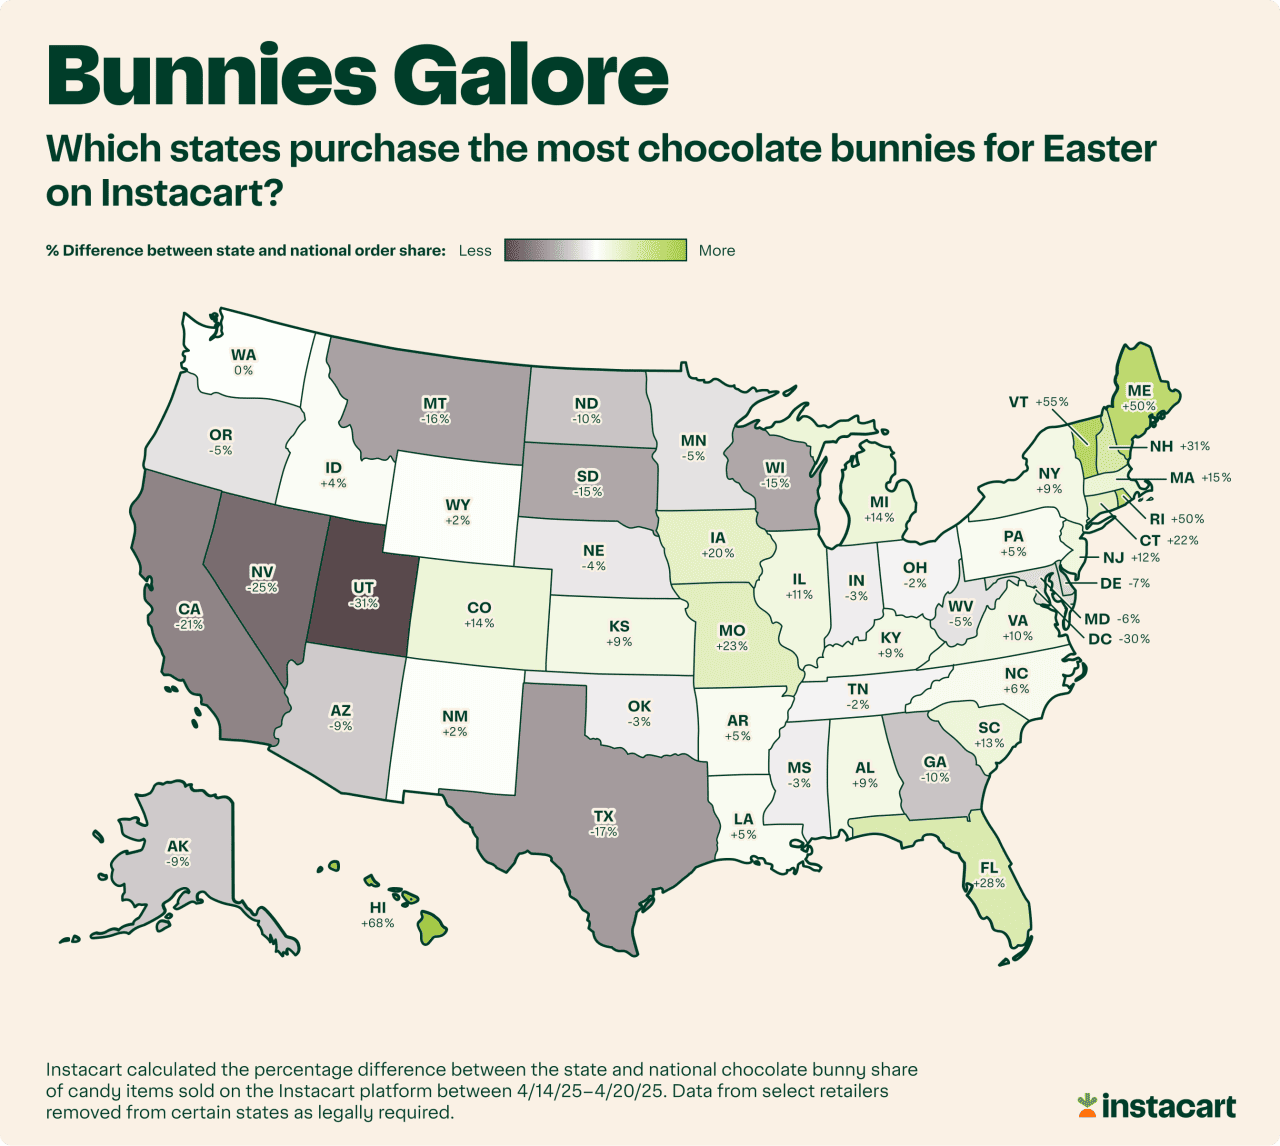
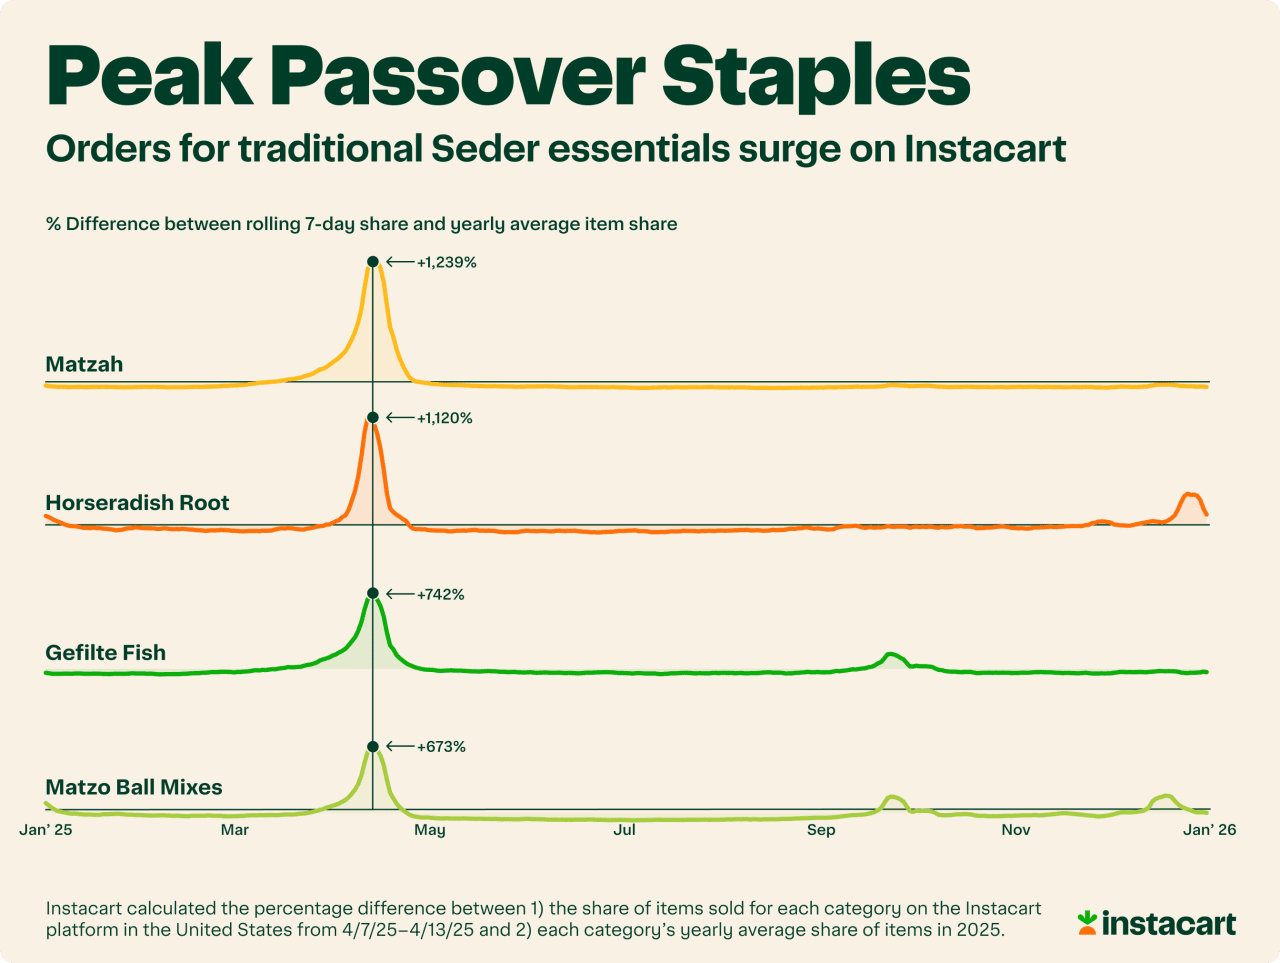


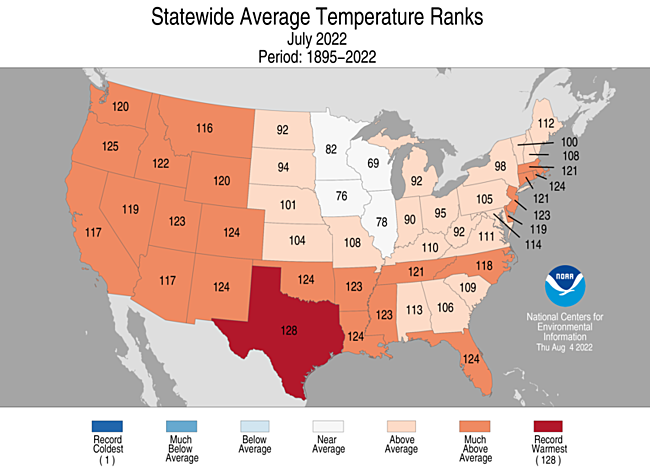